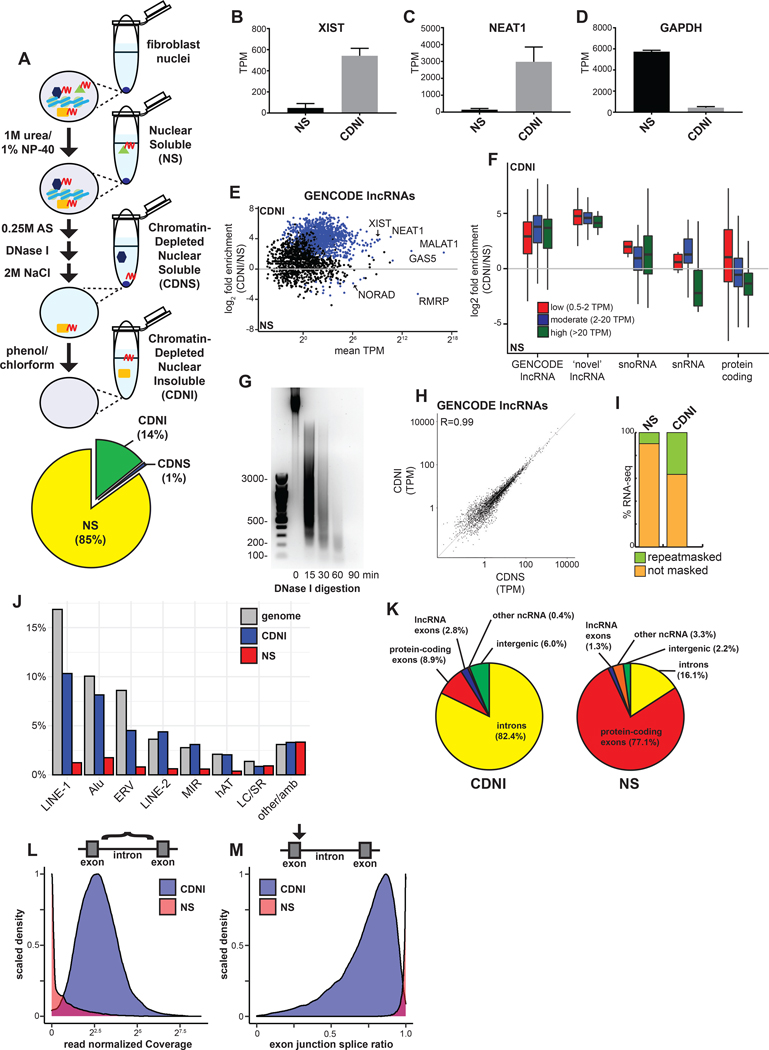
Figure 3. Nuclear ncRNAs and intronic sequences are enriched with insoluble substructure independent of chromatin.
(A) Schematic of subnuclear fractionation protocol. RNA (red) and associated proteins are solubilized by serial biochemical extraction procedures from TIG-1 nuclei and a pie chart of RNA (average by mass, n=2) extracted for each fraction. (B-D) Relative abundance of XIST, NEAT1, and GAPDH RNAs in transcripts per million (TPM) from RNA-seq. Error bars represent SEM. (E) Enrichment of GENCODE lncRNAs in the CDNI relative to NS fraction. Blue dots indicate significant enrichment (p < 0.05). (F) Boxplot of RNA enrichment grouped by subtype in the CDNI and NS fractions. RNAs binned by mean abundance. (G) SYBR Safe stained 1.5% agarose gel of DNA isolated from CDNI material after DNase I digestion. (H) Relative abundance of lncRNAs in CDNI and CDNS fractions. (I) Stacked bar graph of RNA-seq mapping to Repeatmasker repeats. (J) Bar graph of RNA-seq mapping to indicated repeats relative to their abundance in the genome (LC, low complexity; SR, simple repeats; amb, ambiguous). (K) Percent of CDNI and NS RNA-seq mapping to genomic features. (L) Distribution of total read normalized intron coverage in NS (red) and CDNI (blue) fractions. (M) Distribution of exon-intron splice ratios derived from analysis of spliced and unspliced intron-exon junction read depth (spliced/spliced+unspliced depth) in NS (red) or CDNI (blue) fractions.

