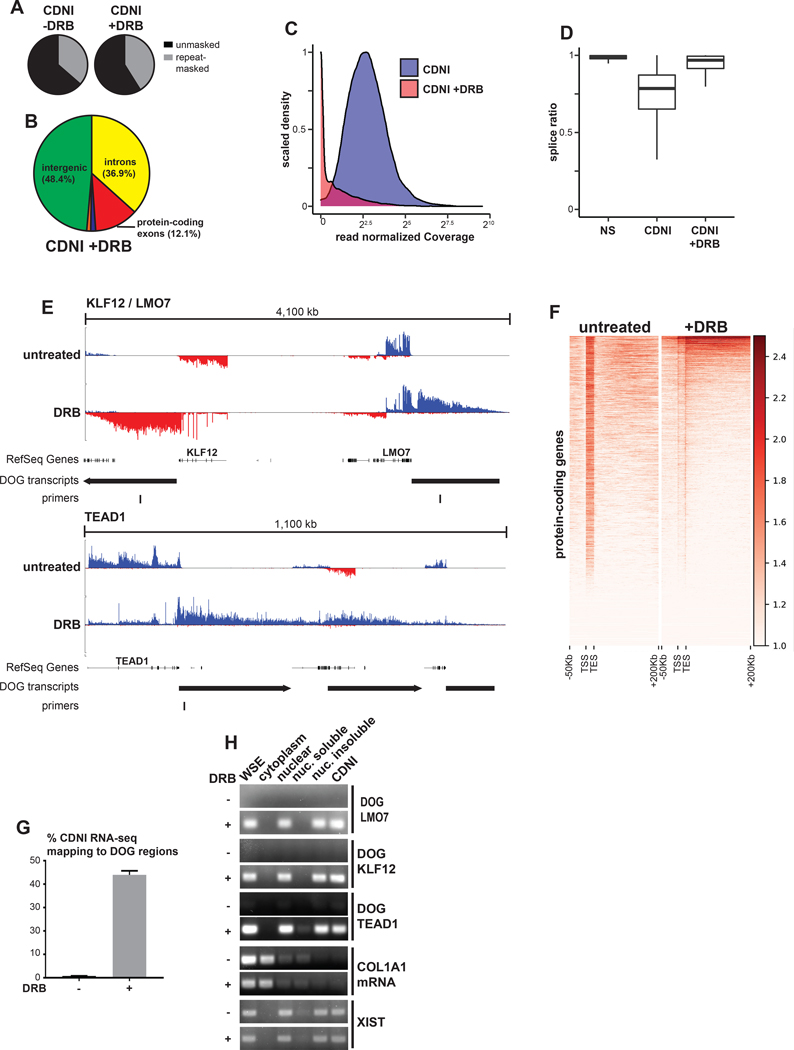
Figure 4. DRB can induce insoluble intergenic transcripts.
(A) Percent of CDNI RNA-seq from mock or DRB-treated (4 hours) cells mapping to Repeatmasker repeats. (B) Percent of CDNI RNA-seq from mock or DRB-treated cells mapping to genomic features. Pie chart colors and calculations match those in Figure 3. (C) Distribution of total read normalized intron coverage for introns in the CDNI fraction with (red) and without (blue) DRB treatment. (D) Box plot of intron splice ratios found in RNA-seq fractions (see Figure 3M). (E) CDNI RNA-seq coverage. RefSeq genes, downstream of gene (DOG) regions, and primers used in this study are indicated. (F) Meta-gene heatmap of RNA-seq coverage, log2(1+ RPKM) transformed, in the sense direction only for protein-coding genes on the forward strand. (G) Percent of uniquely mapping reads mapping to DOG regions in CDNI RNA-seq from untreated or DRB-treated cells. (H) RT-PCR analysis of DOG regions from control or DRB-treated cells in indicated fractions. RT-PCR was performed on a per cell equivalent amount of RNA for each fraction. COL1A1 mRNA primers are exon-spanning.

