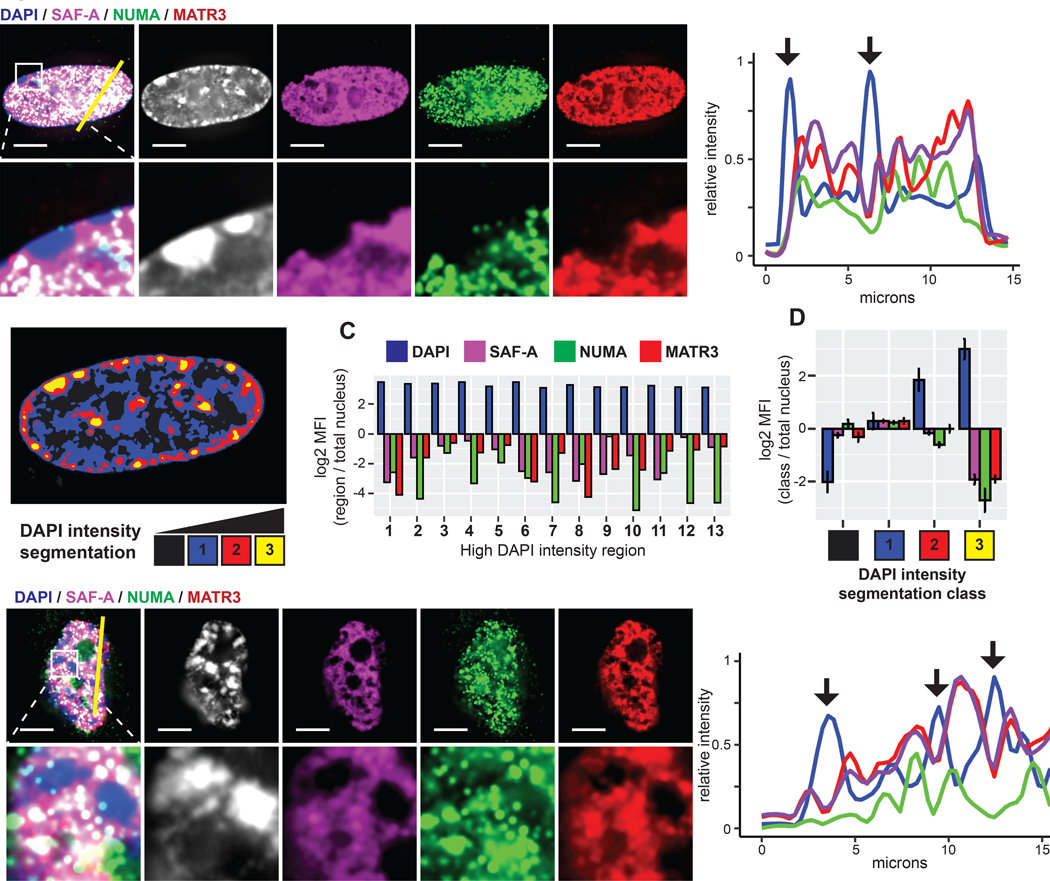
Figure 5. Specific nuclear scaffold proteins are depleted from heterochromatin.
(A) Immunofluorescence of NUMA, MATR3, and SAF-A in TIG-1 fibroblasts. Higher magnification below. Line-scan of signal intensities for the indicated region shown at right. (B) DAPI intensity segmentation of the above nucleus. Numbers indicate high DAPI intensity bodies (yellow). (C) Log2 ratio of the mean signal intensity within each indicated high intensity body compared to entire nucleus. (D) Log2 ratio of the mean signal intensity within DAPI intensity segmentation classes compared to the entire nucleus. Error bars represent SEM of the log2 ratio determined for multiple nuclei (n=4). (E) IF of NUMA, MATR3, and SAF-A in high passage (35) fibroblasts. Proteins were visibly depleted from high DAPI intensity bodies (SAHFs, arrows) in all cells with greater than 5 SAHFs (n=21). Higher magnification shown below and line-scan for the indicated region on right. Scale bars 5 μm

