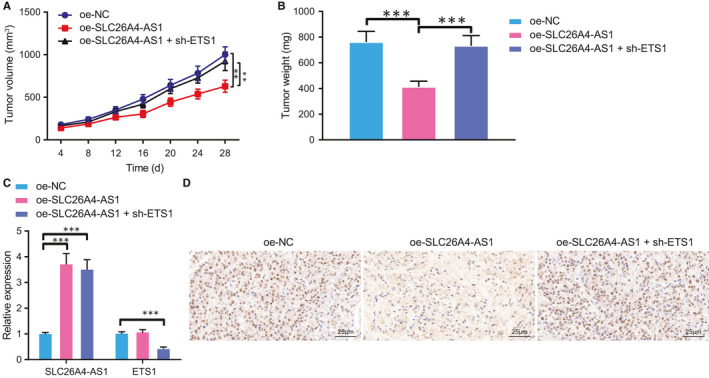
FIGURE 5.

SLC26A4‐AS1 represses tumour growth through up‐regulation of ITPR1 by ETS1. A, Representative macroscopic images of mouse tumour upon treatment of oe‐SLC26A4‐AS1, oe‐SLC26A4‐AS1 + sh‐ETS1 or controls. B, Quantification of tumour weight upon treatment of oe‐SLC26A4‐AS1, oe‐SLC26A4‐AS1 + sh‐ETS1 or controls. C, RT‐qPCR analysis of SLC26A4‐AS1 and ETS1 expression in oe‐SLC26A4‐AS1‐ and sh‐ETS1‐treated mice and or controls. D, Immunohistochemistry of ITPR1 protein expression upon all treatments (×400). * P < .05 vs. oe‐NC, ** P < .01, and *** P < .001. Measurement data were expressed as mean ± standard deviation. Analysis among multiple groups was conducted by ANOVA followed by Tukey's post hoc test. Data at different time points among groups were compared by repeated measures ANOVA, followed by Bonferroni
