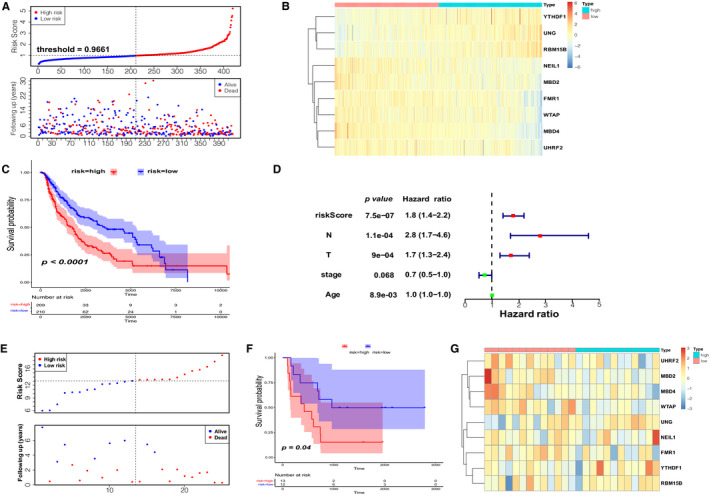
FIGURE 5.

Prognostic signature of the nine m1A‐, m5C‐ and m6A‐related regulators in internal and external data set. (A) The distributions of prognostic signature‐based risk scores. (B) The heat map of the expression of the nine regulators in different risk subgroups. (C) The K‐M analysis showed that patients in the low‐risk group presented better OS than the high‐risk group. This analysis was based on the survival information of samples in the training set. The red line represents the high‐risk cluster, whereas the blue line indicates the low‐risk cluster. (D) Forrest plot of the independent prognostic factors in CM. (E) The distributions of risk score and survival status in the external validation set (GSE100797). (F) K‐M prognosis curve of the validation set. (G) The heat map of regulators’ expression clustered at the risk subgroups in 25 CM patients
