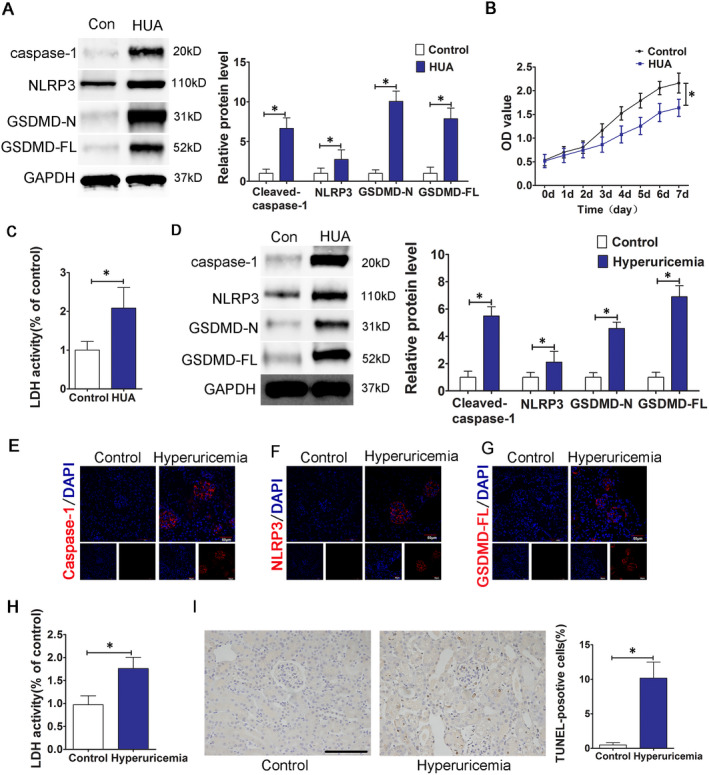
FIGURE 2.

HUA induces the activation of the NLRP3 inflammasome and pyroptosis. (A) The protein levels of caspase‐1, NLRP3, GSDMD‐N and GSDMD‐FL, as measured by Western blot analysis; quantification normalized to GAPDH in HUA‐treated HUVECs. The HUA group showed increased caspase‐1, NLRP3, GSDMD‐N, GSDMD‐FL protein expression levels after 24 h of stimulation; p < 0.05 compared to the control group; n = 3 in each group. (B) Cell viability of HUA‐treated HUVECs was determined by the CCK‐8 assay. The growth of HUVECs was significantly inhibited in HUA group. *p < 0.05 compared to the control group; n = 3 in each group. (C) LDH secretion in HUA‐treated cells was assessed using a commercial kit. LDH release increased significantly in HUA group. *p < 0.05 compared to the control group; n = 3 in each group. (D) The protein levels of caspase‐1, NLRP3, GSDMD‐N and GSDMD‐FL, as measured by Western blot analysis; quantification normalized to GAPDH in renal tissue from hyperuricaemia mice. The protein levels of caspase‐1, NLRP3, GSDMD‐N and GSDMD‐FL increased significantly in hyperuricaemia group. *p < 0.05 compared to the control group; n = 6 in each group. (E–G) Immunofluorescence images showing the expression of caspase‐1, NLRP3 and GSDMD‐FL in renal tissue from hyperuricaemia mice. Tissue immunofluorescence showed that the fluorescence intensity of glomerular NLRP3, caspase‐1 and GSDMD‐FL in the hyperuricaemia group was significantly higher than that in the control group. *p < 0.05 compared to the control group; n = 6 in each group (scale bar, 50 μm; magnification, 400×); blue: nuclear staining (DAPI), red: caspase‐1, NLRP3 and GSDMD‐FL staining. (H) Levels of LDH in mouse serum, measured using a commercial kit. LDH release increased significantly in the hyperuricaemia group. *p < 0.05 compared to the control group; n = 6 in each group. (I) TUNEL staining of renal tissue sections from control mice or hyperuricaemia mice. The number of positive cells in the kidney of HUA mice increased significantly in hyperuricaemia group. *p < 0.05 compared to the control group; n = 6 in each group (scale bar, 100 μm; magnification, 400×); blue, nuclear staining (DAPI)
