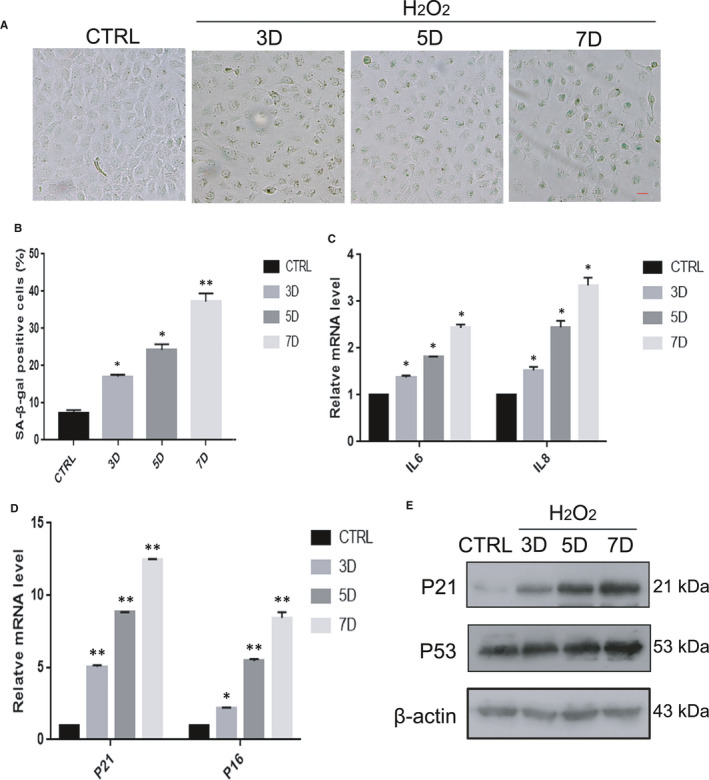
FIGURE 2.

Oxidative stress‐induced senescence in HLE‐B3 cells in vitro. HLE‐B3 cells were treated with H2O2 for 3–7 days. CTRL means untreated cells. (A). Representative images of SA‐β‐Gal staining of the cells. (B). Percentages of SA‐β‐Gal‐positive cells. (C). Relative fold‐changes in the mRNA levels of the genes encoding IL6 and IL8, as determined by qRT‐PCR. (D). Relative fold‐changes in the mRNA levels of the genes encoding P53 and P21, as determined by qRT‐PCR. (E). Western blot analysis of P53, P21 and β‐actin in HLE‐B3 cells treated with H2O2 (150 μM) for 3–7 days. Data were shown as mean ± SD and are representative of 3 independent experiments. *p<0.05; **p < 0.01 compared to the control (CTRL). The bar represents 20 um
