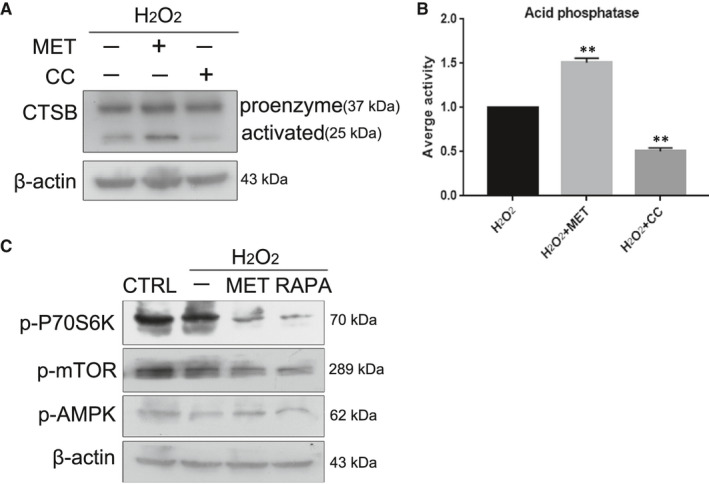
FIGURE 8.

MET restored the oxidative stress‐impaired autophagic flux associated with improvements in lysosomal function and mTOR inactivation. (A). Western blot analysis of CTSB and β‐actin. (B). Relative fold‐changes in the protein levels of CTSB as described in A. (C). Western blot analysis of p‐P70S6K (Thr389), p‐MTOR (Ser2448), p‐AMPKα (Thr172) and β‐actin in HLE‐B3 cells treated with H2O2 (150 μM), MET (2 mM), RAPA (50 nM). **p < 0.01 compared to the indicated sample
