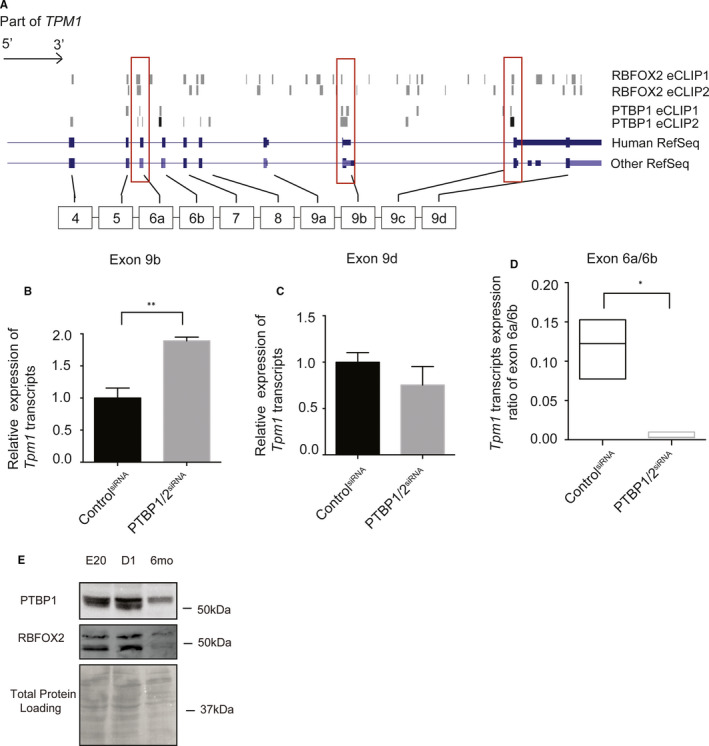
FIGURE 3.

PTBP controls developmentally regulated AS of Tpm1 antagonistically to RBFOX2. (A) RBFOX2 eCLIP and PTBP1 eCLIP‐seq reads mapped to the human Tpm1 gene. (B) Expression levels of Tpm1 transcripts containing exon 9b (muscle) in H9c2 cells treated with control or PTBP1/2 siRNA. mRNA levels in control cells were normalized to 1. Statistical significance was calculated using t test to compare two different groups in three independent experiments (n = 3). p‐value is represented as **p = .0050. (C) Expression levels of Tpm1 transcripts containing exon 9d (non‐muscle) in H9c2 cells treated with control or PTBP1/2 siRNA. mRNA levels in control cells were normalized to 1. (D) Expression of Tpm1 transcripts containing exon 6a vs. 6b in H9c2 cells treated with control or PTBP1/2 siRNA. Data represent means ± SD. Expression ratio of Tpm1 exon 6a to 6b in control cells was normalized to 1. Statistical significance was calculated using t test to compare two different groups in three independent experiments (n = 3). p‐value is represented as *p = .0347. (E) Western blot analysis of PTBP1 and RBFOX2 in rat hearts at different embryonic and postnatal stages. Even protein loading was monitored by Ponceau S stain of the membrane
