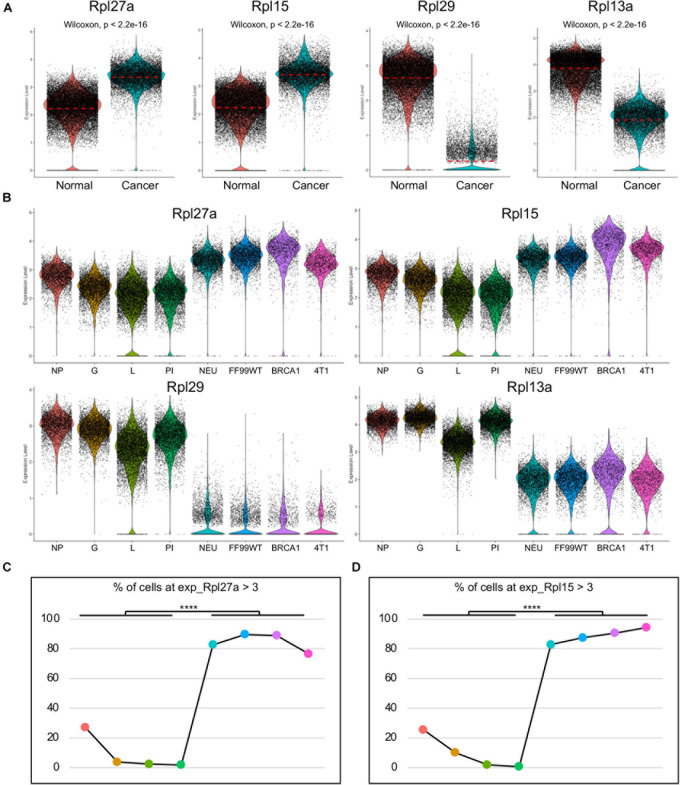
FIGURE 2.
Upregulated Rpl27a and Rpl15 in cancer cells of the mouse models. (A) Violin plots showing transcription levels of Rpl27a, Rpl15, Rpl29, and Rpl13a in normal epithelial cells and breast cancer cells. (B) Visualization of transcription levels of Rpl27a, Rpl15, Rpl29, and Rpl13a in epithelial cells of each developmental stage and breast cancer cells of each mouse model by split violin plots. (C,D) Quantification of the percentage of cells with Rpl27a > 3 (C) or Rpl15 > 3 (D) in each developmental stage and breast cancer mouse model. ****p < 0.0001.

