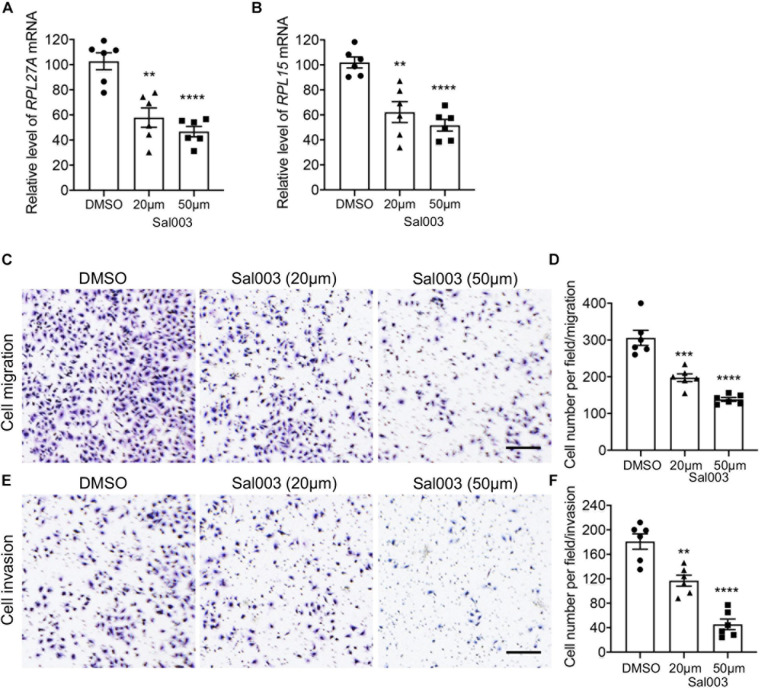
FIGURE 8.
Blocking EIF2 signaling decreased TNBC cell migration and invasion. (A,B) mRNA levels of RPL27A and RPL15 in MDA-MB-231 cells after treatment of different doses of the EIF2 signaling inhibitor Sal003. (C,E) Representative images of migration (C) and invasion (E) assays on MDA-MB-231 cells after treatment of different doses of Sal003 or DMSO control. (D,F) Quantification of cell numbers in each image of migration (D) and invasion (F) assays. Scale bar, 50 μm. **p < 0.01; ***p < 0.001; ****p < 0.0001.

