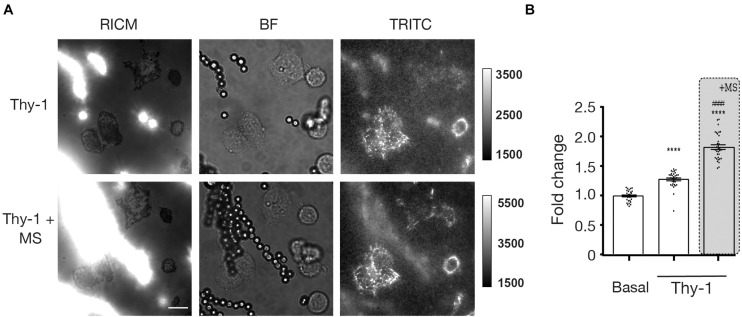
FIGURE 4.
Traction forces are increased after Thy-1 and mechanical stress stimulation in astrocytes. (A) Representative images of DITNC1 cells stimulated only with Protein A-magnetic beads coated with Thy-1 (top row) or with Thy-1-Protein A-magnetic beads plus mechanical stress (MS) (bottom row). The left column corresponds to Reflection Interference Contrast Microscopy (RICM), the middle column shows Bright Field (BF), and the right column, Total Reflection Internal Fluorescence of Traction Forces (TRITC). Magnification bar = 12 μm (B) Quantification of mean fluorescence intensity measuring traction force for the basal, Thy-1 alone (for 5 min) and Thy-1 + mechanical stress (for 5 min) conditions (at least 30 cells per condition were counted). Values were normalized to the fluorescence intensity observed for cells without bead contact at the same time point for each condition (value + s.e.m. of three independent experiments). Statistical significance was calculated using the Kruskal–Wallis non-parametric test, with Dunn’s multiple comparison. ****p < 0.0001, compared with basal tension; ####p < 0.0001, compared with the tension corresponding to Thy-1 only.

