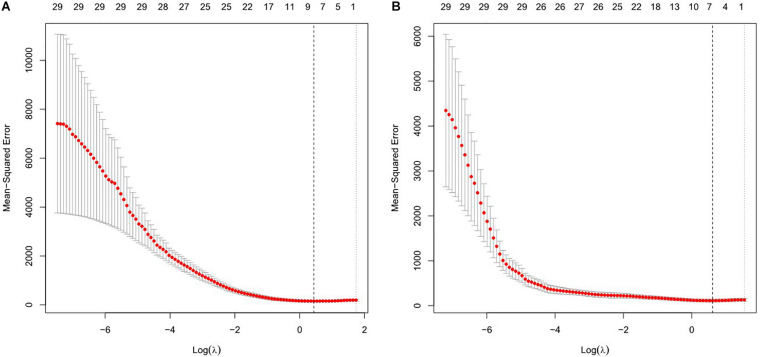
FIGURE 1.
Features selection using the least absolute shrinkage and selection operator (LASSO) regression model for resting motor threshold (RMT) (A) and active motor threshold (AMT) (B). The horizontal axis plotted value of log λ and the vertical axis plotted mean squared error. The dotted vertical line was plotted at the optimal λ values based on minimum criteria.

