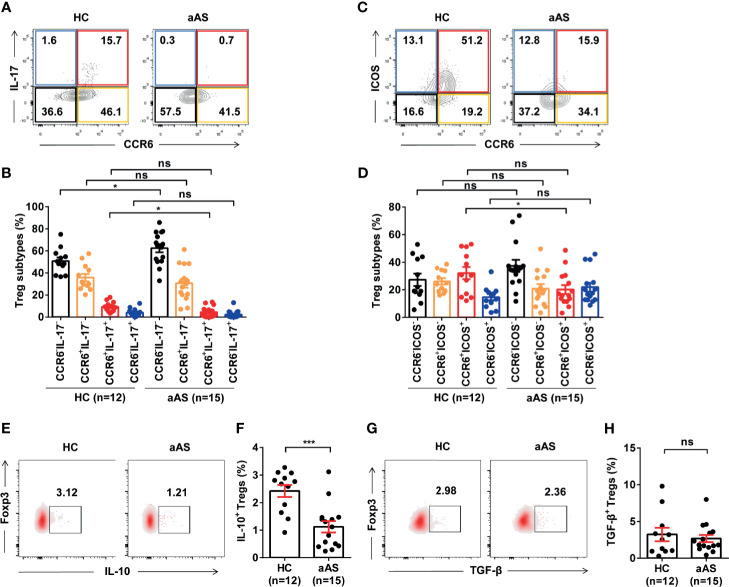
Figure 3.
Peripheral Treg cell subsets and function are altered in patients with allergic asthma. (A, B) CCR6 vs. IL-17 expression of CD3+CD8-CD25+Foxp3+ Treg cells from the healthy donor (n =12) and patients with asthma (n = 15) analyzed with FACS. Representative dot plots are shown. (C, D) ICOS vs. CCR6 expression of CD3+CD8-CD25+Foxp3+ Treg cells from the healthy donor (n =12) and patients with asthma (n = 15) analyzed using FACS. Representative dot plots are shown. (E, F) IL-10+Foxp3+ Treg cells from the healthy donor (n = 12) and patients with asthma (n =15) analyzed with FACS. Representative dot plots are shown. (G, H) TGF-β+Foxp3+ Treg cells from the healthy donor (n = 12) and patients with asthma (n = 15) analyzed using FACS. Representative dot plots of are shown. Bars represent the mean ± SEM. *P < 0.05, ***P < 0.001; ns, not significant.

