FIGURE 2.
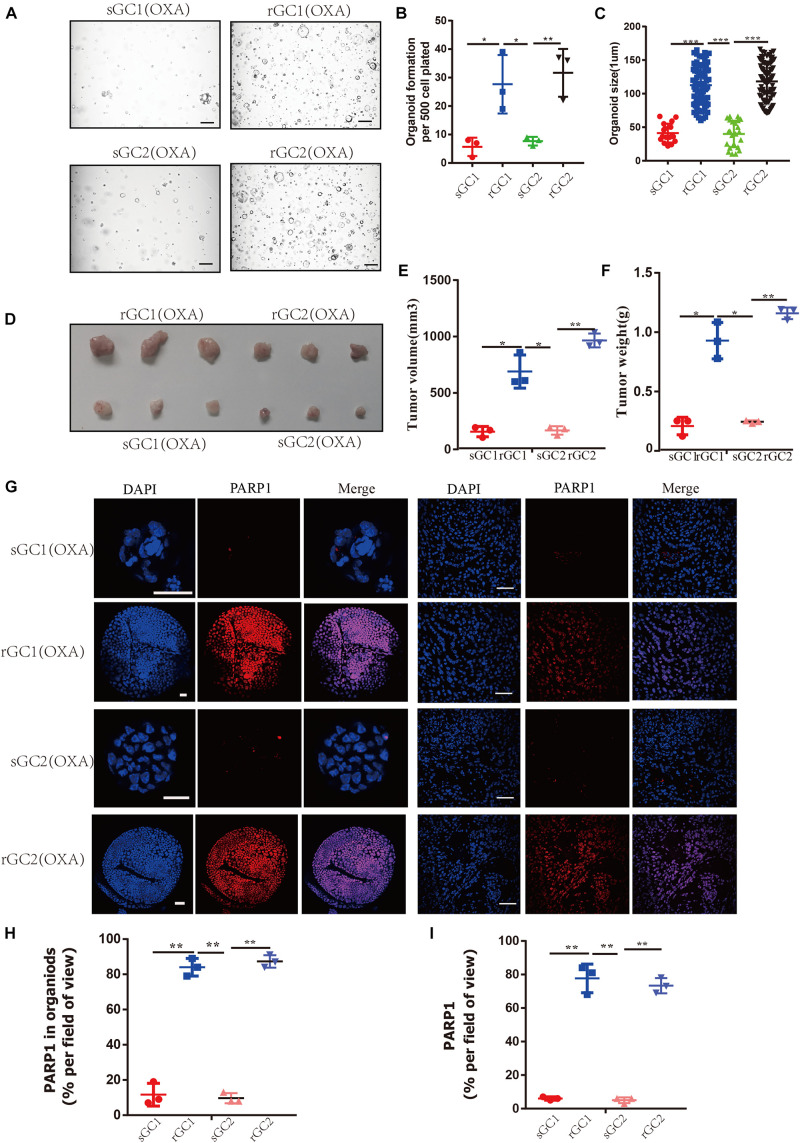
PARP1 is upregulated in oxaliplatin resistance gastric cancer. (A–C) sGC1, sGC2, rGC1, and rGC2 organoids were treated with Oxaliplatin before imaging (A), number of organoids (B), and size of organoids (C). (D) Representative images of tumorigenesis in BALB/C NUDE mice treated with Oxaliplatin. The ruler represents 1 cm. (E) Tumour growth curves of organoids in PDOX BALB/C Nude mice. The curve shows the average tumor volume. Error bars represent mean ± standard deviation. (F) Mass of tumors of PDOX in BALB/C NUDE mice. The curve shows the average tumor mass. (G) Representative images of PARP1 levels stained by immunofluorescence in organoid and tumors. The scale bar represents 20 μm for tumour images, 200 μm for organoid images. (H) Proportion of PARP1 + cells in organoid (G,I), proportion of PARP1 + cells in tumor (G). The Student’s t test was used for statistical analysis. Error bars indicate mean ± standard deviation. *< 0.05, **< 0.01, and ***< 0.001. All experiments were repeated three times.

