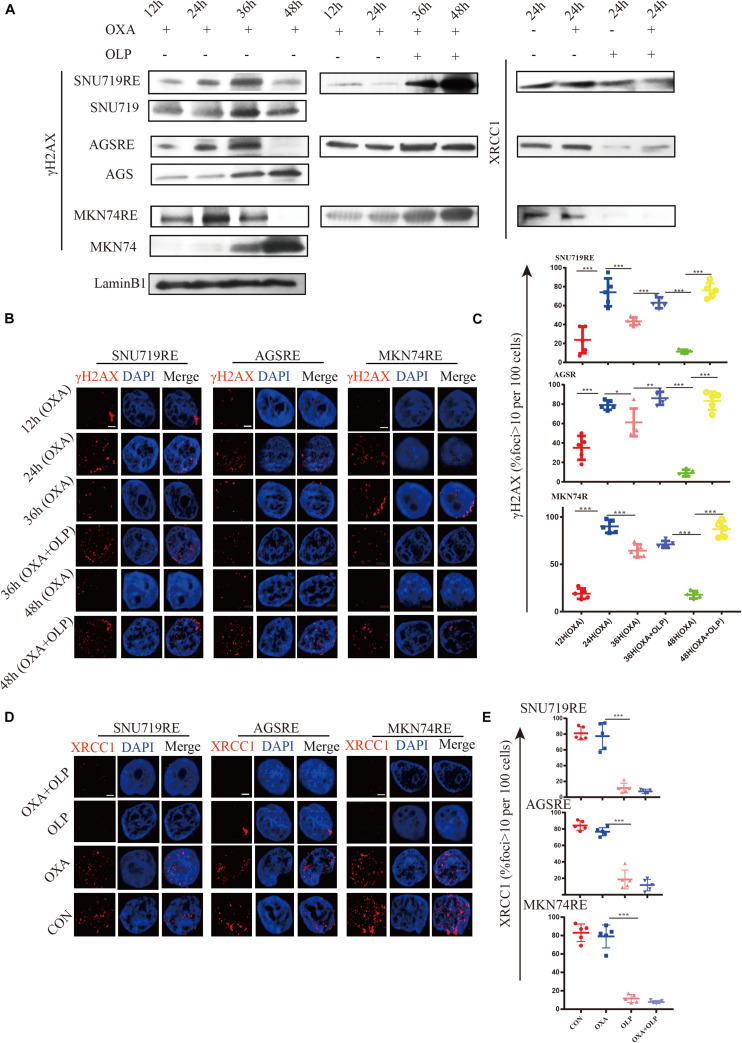
FIGURE 5.
The inhibition of PARP1 can significantly enhance the DNA damage and inhibit BER of Oxaliplatin-resistant GC. (A) Comparison of γH2AX expression in Olaparib + Oxaliplatin, Oxaliplatin, Olaparib, and the blank control group and the MKN74, SNU719, AGS resistant strains, and their corresponding wild-type cell lines at different times. Comparison of XRCC1 expression in Olaparib + Oxaliplatin, Oxaliplatin, Olaparib, and the blank control group in MKN74, SNU719, and AGS Oxaliplatin resistance strains. (B) Immunofluorescent comparison of γH2AX expression in Olaparib + Oxaliplatin, Oxaliplatin, Olaparib, and the blank control group and the MKN74, SNU719, AGS resistant strains, and their corresponding wild-type cell lines at different times. (C) Ratio of γH2AX + cells in MKN74, SNU719, AGS Oxaliplatin resistance strains, and their corresponding wild-type cell line (B,D) immunofluorescent comparison of XRCC1 expression in Olaparib + Oxaliplatin, Oxaliplatin, Olaparib, and the blank control group in MKN74, SNU719, and AGS Oxaliplatin resistance strains. The scale represents 2 um. (E) Ratio of XRCC1 cells in MKN74, SNU719, AGS Oxaliplatin resistance strain and their respective wild-type cell lines (D), respectively. The Student’s t test was used for statistical analysis. Error bars indicate mean ± standard deviation. OXA, Oxaliplatin. OLP, Olaparib. CON, control group. AGSR, AGS Oxaliplatin resistance. SNU719R, SNU719 Oxaliplatin resistance. MKN74R, MKN74 Oxaliplatin resistance. *< 0.05, **< 0.01, and ***< 0.001. All experiments were repeated three times.

