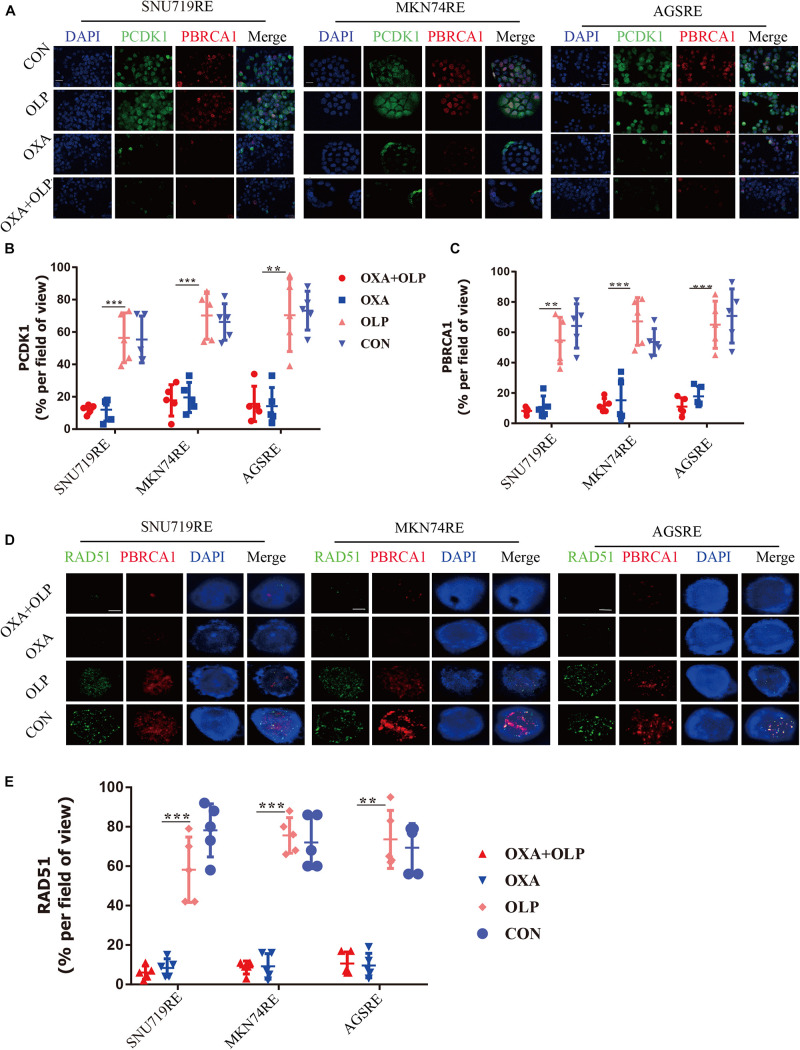
FIGURE 7.
Oxaliplatin inhibits HR repair pathways via blocking both CDK1-BRCA1. (A) Representative images of immunofluorescent CDK1 phosphorylation and BRCA1 phosphorylation staining of Olaparib + exaliplatin, Oxaliplatin, Olaparib, and blank control group in MKN74, SNU719, AGS Oxaliplatin resistance cell lines. The scale represents 20 um. Drug action time was 36 h. (B,C) Proportion of CDK1 phosphorylation and BRCA1 phosphorylation positive cells (A), respectively. (D) Representative images of immunofluorescent phosporylation staining comparisons of Olaparib + Oxaliplatin, Oxaliplatin, Olaparib and blank control group and immunofluorescent phosphorylation staining of RAD51 and BRCA1 of MKN74, SNU719, AGS resistant strains RAD51, and BRCA1 at different time. The scale represents 2 um. (E) Statistical analysis of RAD51 + cells in (D). The Student’s t test was used for statistical analysis. Error bars indicate mean ± standard deviation. OXA, Oxaliplatin. OLP, Olaparib. CON, control group. PCDK1, CDK1 phosphorylation antibody. PBRCA1, BRCA1 phosphorylation antibody. AGSRE, AGS Oxaliplatin resistance. SNU719RE, SNU719 Oxaliplatin resistance. MKN74RE, MKN74 Oxaliplatin resistance. *< 0.05, **< 0.01, and ***< 0.001. All experiments were repeated three times.

