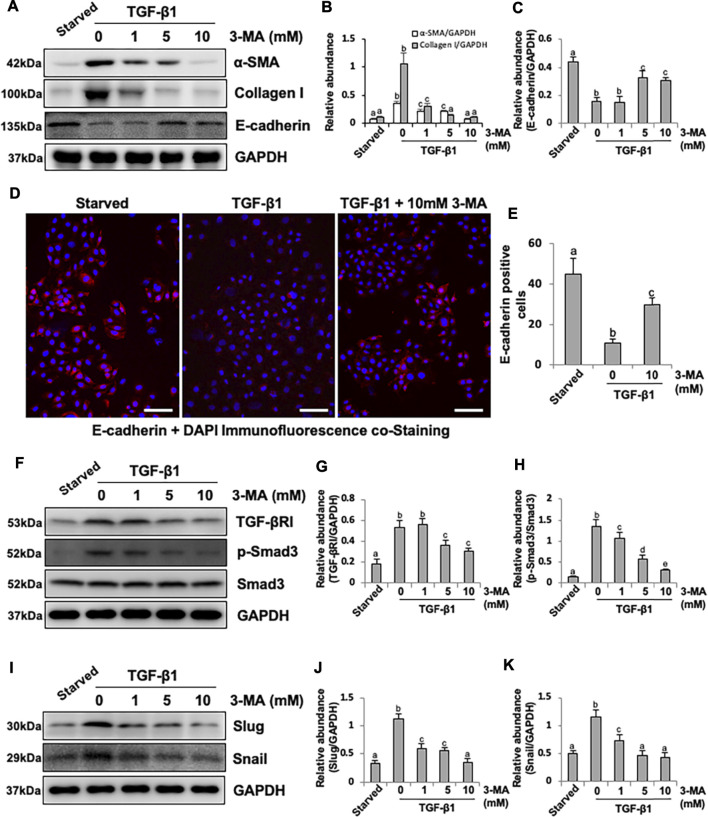
FIGURE 5.
Inhibition of autophagy with 3-MA blocks EMT in HPMCs by regulating TGF-β/Smad3 signaling pathway and downstream nuclear transcription factors: Slug and Snail. (A) Cell lysates were subjected to immunoblot analysis with specific antibodies against α-SMA, Collagen I, E-cadherin and GAPDH. (B, C) Expression levels of α-SMA, Collagen I and E-cadherin were quantified by densitometry and normalized with GAPDH. (D) Photomicrographs show immunofluorescence co-staining of E-cadherin and DAPI. (E) The count of E-cadherin-positive cells. (F, I) Cell lysates were subjected to immunoblot analysis with specific antibodies against TGF-βRI, p-Smad3, Smad3, Slug, Snail and GAPDH. (G) Expression level of TGF-βRI was quantified by densitometry and normalized with GAPDH. (H) Expression level of p-Smad3 was quantified by densitometry and normalized with Smad3. (J, K) Expression levels of Slug and Snail were quantified by densitometry and normalized with GAPDH. Data are represented as the mean ± SEM. Means with different superscript letters are significantly different from one another (p < 0.05). All scale bars = 100 μm.

