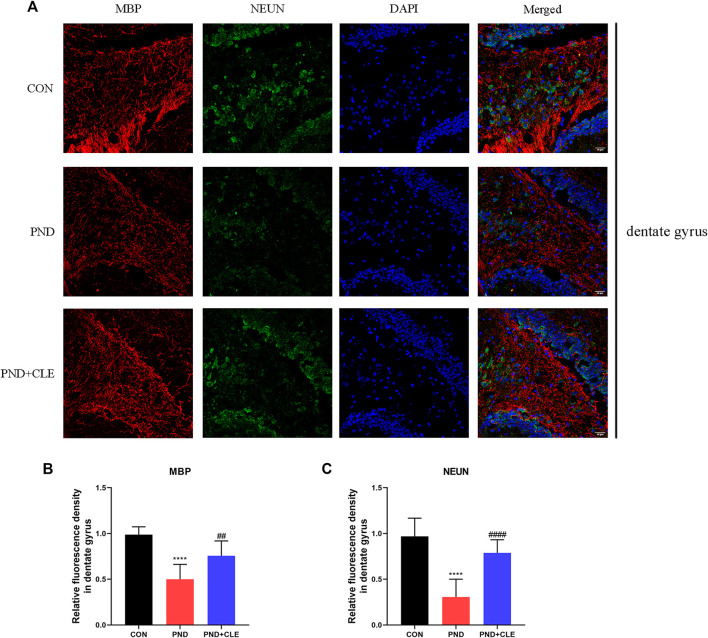
FIGURE 7.
Immunofluorescence analysis detected MBP and NEUN protein levels in hippocampal dentate gyrus (scale bar = 50 µm). (A) Representative images of MBP and NEUN in the dentate gyrus. (B) Mean fluorescence density of MBP in the dentate gyrus. (C) Mean fluorescence density of NEUN in the dentate gyrus. The data are presented as mean ± S.D. (n = 10 mice per group). ****p < 0.001 compared with the CON group. ## p < 0.01 compared with the PND group. #### p < 0.001 compared with the PND group.

