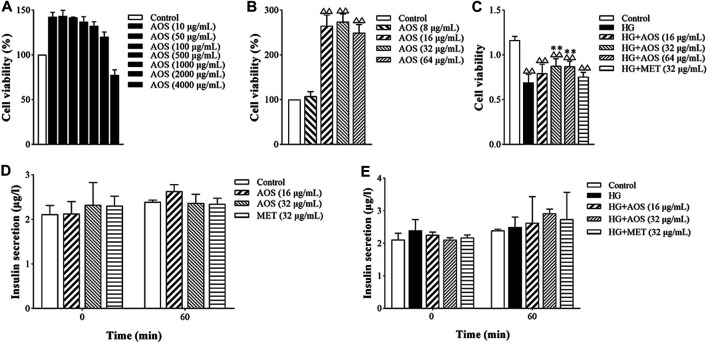
FIGURE 5.
AOS improved the proliferation of pancreatic MIN6 cells. (A) MIN6 cells were cultured and treated with different concentrations of AOS (0, 10, 50, 100, 500, 1,000, 2000, and 4,000 μg/ml) for 24 h △△ p < 0.01 versus control (0 μg/ml) group. (B) MIN6 cells were treated with different concentrations of AOS (0, 8, 16, 32, and 64 μg/ml) for 24 h. (C) MIN6 cells were incubated with normal glucose (5.5 mM) or high glucose (33.3 mM) for 24 h, and then the cells were cultured in the absence or presence of AOS with different concentrations (16, 32, and 64 μg/ml) for 24 h △△ p < 0.01 versus control (0 μg/ml) group; ** p < 0.01 versus the high-glucose group. (D) The insulin levels after incubation with AOS for 1 h. (E) The insulin levels after incubation with glucose for 1 h.

