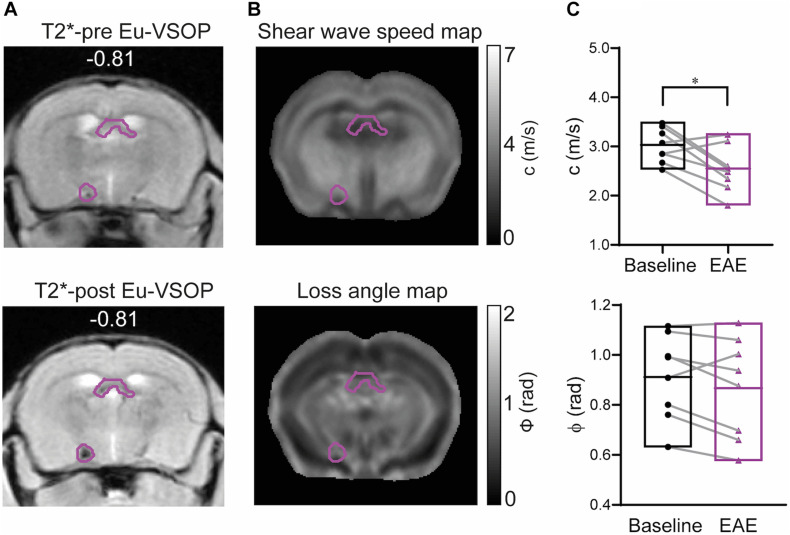
FIGURE 6.
Brain mechanical properties of areas accumulating Eu-VSOPs during EAE. (A) Exemplary image of a mask comprising Eu-VSOP accumulation overlaid on T2*-weighted image prior (left) and post Eu-VSOP (right) injection. (B) Shear wave speed map (c in m/s) and loss angle map (ϕ in rad). (C) There is a significant reduction in stiffness in sites with Eu-VSOP accumulation compared to non-hypointense areas (p = 0.0235, paired t-test). Fluidity of brain tissue in these areas, marked by ϕ, is not affected (p = 0.1168, paired t-test). n = 8, mean, min/max; *<0.05. Of note, ventricles are excluded from our analysis since MRE cannot be performed in fluid compartments.

