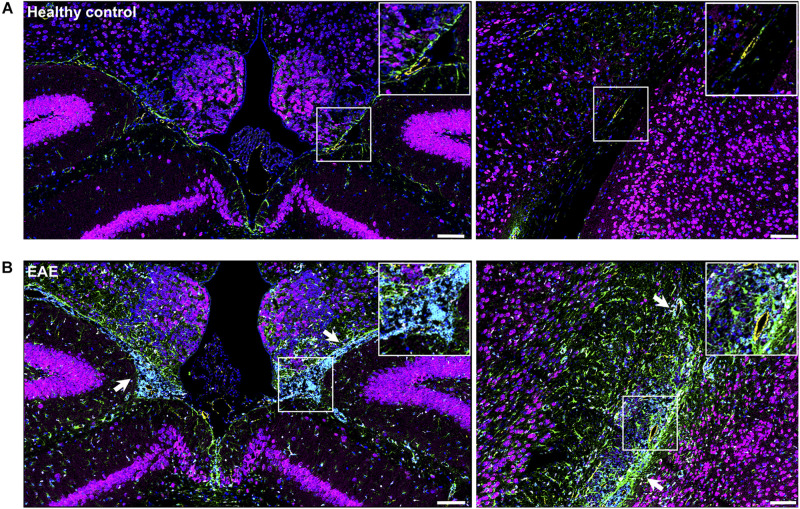
FIGURE 8.
Visualization of brain inflammation induced by EAE using IMC. (A) Brain section of a healthy control (naïve) mouse at the third ventricles (left) and brain stem and hippocampal formation (right). (B) Extensive inflammation during EAE can be visualized by infiltration of CD45+ cells (cyan), astrogliosis (GFAP, green) and activated microglia (Iba-1, white) (white arrows). Neurons (NeuN—magenta), astrocytes (GFAP—green), endothelial cells (CD31—yellow), nuclei (histone H3—blue), microglia (Iba-1—white), leucocytes (CD45—cyan). Scale bar: 100 μm.

