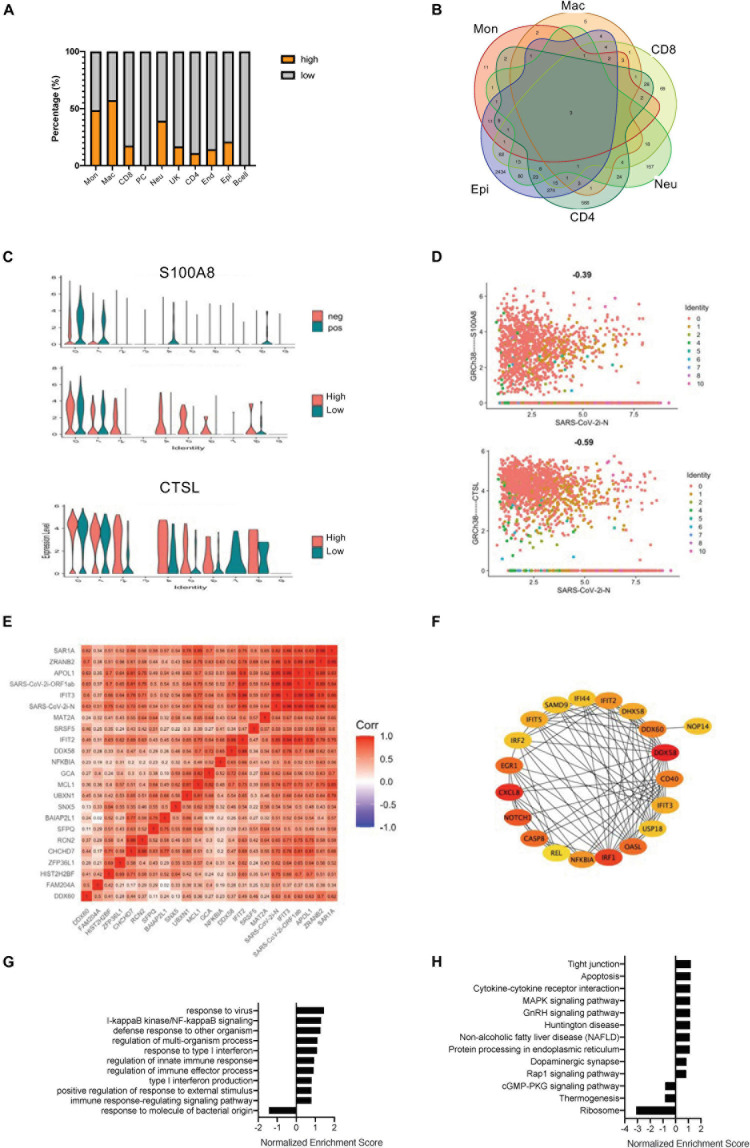
FIGURE 2.
Correlation of SARS-CoV-2 infection with the COVID-19–related gene signatures. (A) Bar charts to quantify the proportion of heavily loaded SARS-CoV-2 in the main cell types. (B) A Venn diagram highlighting the intersecting gene signatures of heavily loaded SARS-CoV-2 cells. (C) Violin plots indicating the levels of S100A8 expression in SARS-CoV-2 positive and negative cells. Violin plots indicating the expression levels of S100A8 and CTSL in heavily loaded SARS-CoV-2 cells. (D) Feature plots revealing the relationship between COVID-19–related genes and either S100A8 or CTSL gene expression in heavily loaded SARS-CoV-2 cells. (E) A heat map revealing the relationship between COVID-19–related genes and DEGs in the SARS-CoV-2-infected epithelial cells. (F) The PPI network demonstrating the COVID-19–related infection-correlated hub gene signatures in the SARS-CoV-2-infected epithelial cells. (G) The enriched gene ontology of GSEA analysis for SARS-CoV-2-infected epithelial cell-correlated gene signatures. (H) The enriched KEGG signaling pathway of GSEA analyses for SARS-CoV-2-infected epithelial cell-correlated gene signatures.

