FIGURE 3.
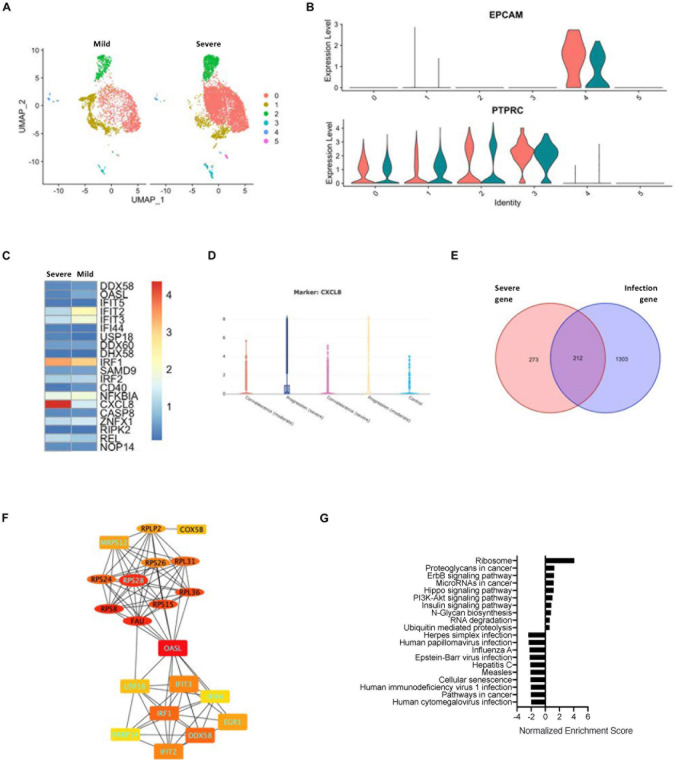
Relationship between SARS-CoV-2 infection in the epithelial cells and severity of COVID-19. (A) A UMAP diagram showing an overlay of the main cell types of the severe and mild ARDS BALF samples. (B) Violin plots to annotate the leukocytes and epithelial cells in the severe and mild ARDS BALF samples. (C) A heat map demonstrating the expression levels of the COVID-19-related PPI hub genes in the severe and mild ARDS BALF samples. (D) Violin plots showing the expression of CXCL8 in the severe disease progression group. (E) A Venn diagram highlighting the intersection between COVID-19–related infection-correlated genes and severe ARDS-related genes. (F) The PPI network demonstrating the shared hub gene signatures between COVID-19–related infection-correlated genes and the severe ARDS-related genes. The oval structures indicate the upregulated genes, and the rectangles indicate the downregulated genes in the severe ARDS cases. Genes labeled with light blue text are positively correlated with SARS-CoV-2 infection. (G) A GSEA summary plot of enriched KEGG signaling for the shared gene signature of COVID-19–related infection-correlated genes and the severe ARDS-related genes.

