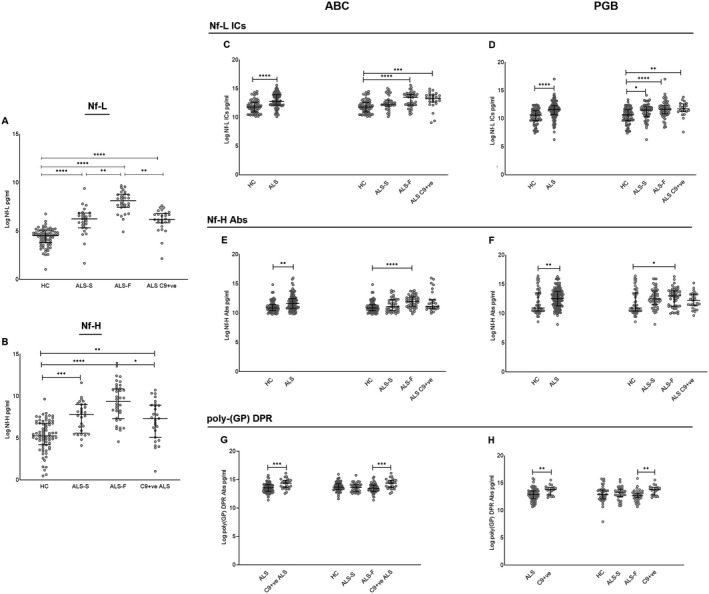
Figure 2.

Nf‐L and Nf‐H protein levels and humoral response to Nf‐L, Nf‐H, and poly‐GP dipeptide repeats (DPR) in phenotypic variants of ALS, in ALS individuals with a C9orf72 mutation (C9+ve) and in healthy controls. Group analysis comparing Nf‐L and Nf‐H protein isoforms concentration, Nf‐L, Nf‐M, and Nf‐H antibodies (Abs) and immuno complexes (ICs) concentration in phenotypic (ALS‐F and ALS‐S) and genotypic (C9+ve) variants of ALS from the ALS biomarkers study (ABC), phenotype–genotype biomarker study (PGB) cohort, and from two groups of healthy controls (HC‐1 and HC‐2, Table 1). Kruskal–Wallis one‐way analysis was used for multiple comparisons. The scatter dot plots show the median with interquartile range. The statistical difference between groups is shown as (****p < 0.0001), (***p < 0.001), (**p < 0.01), (*p ≤ 0.05) or as non‐significant (n.s). (A) Nf‐L protein levels: ABC cohort and HC‐1. (B) Nf‐H protein levels: ABC cohort and HC‐1. (C and D) Nf‐L ICs levels: ABC and PGB cohorts compared to HC‐1 and HC‐2, respectively. (E and F) Nf‐H Abs levels: ABC and PGB cohorts compared to HC‐1 and HC‐2, respectively. (G and H) Poly‐(GP) DPR Abs levels: ABC and PGB cohorts compared to HC‐1 and HC‐2, respectively.
