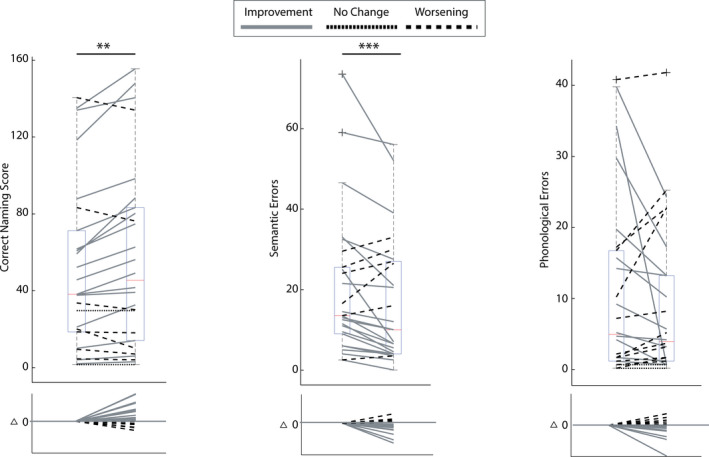
Figure 3.

Box charts summarize participant performance on the Philadelphia Naming Test at baseline and 1‐week post‐treatment. The central mark indicates the median while the 25th and 75th percentiles are indicated by the bottom and top edges of the box, respectively. The whiskers indicate the most extreme non‐outlier data points, and the “x” symbols indicate the outliers. (A) Correct naming score – number of correct attempts; (B) semantic error score – number of semantic paraphasias; (C) phonological error score – number of phonological paraphasias. Solid lines indicate improvement, doted lines indicate no change, and dashed lines indicate worsening from baseline to 1‐week post‐treatment.
