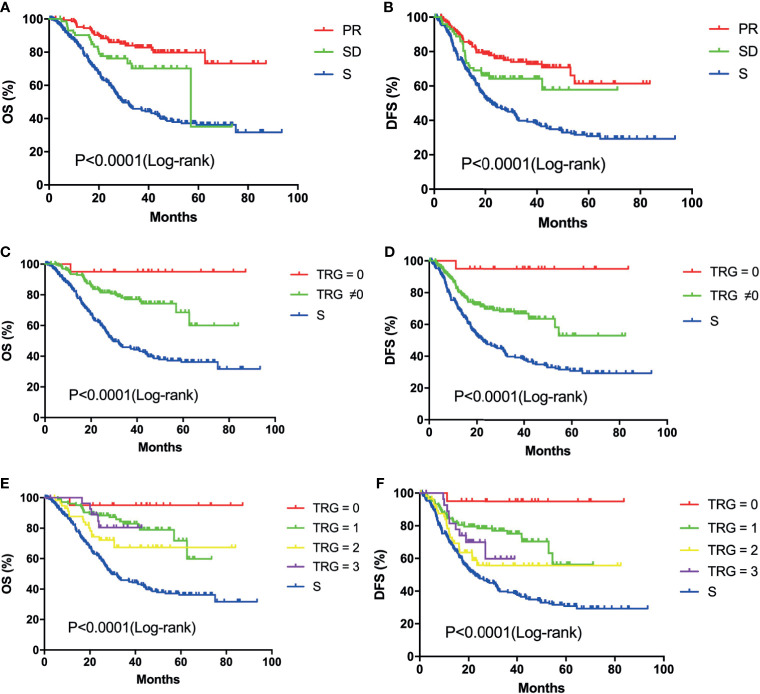
Figure 3.
Kaplan-Meier survival curves of overall survival and disease-free survival: OS (A) and DFS (B) analysis of patients in the PR (n=148), SD (n=73) and S (n=221) groups; OS (C) and DFS (D) analysis of patients in the TRG = 0 (n=20), TRG ≠0 (n=201) and S (n=221) groups; OS (E) and DFS (F) analysis of patients in the different TRG grade (0, n=20; 1, n=107; 2, n=62; 3, n=32) and S (n=221) groups;.

