FIGURE 7.

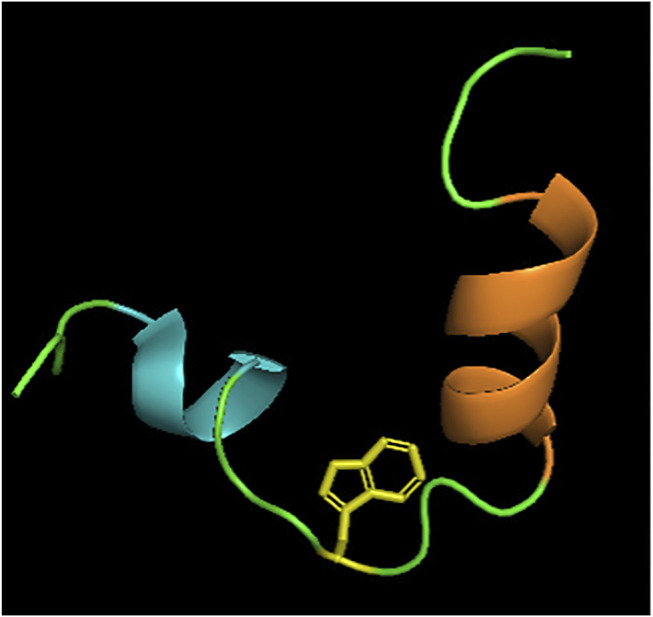
Structure of E1 pre-transmembrane region determined by NOE experiments (Spadaccini et al., 2010). Two alpha helices MAWDM (cyan) and AALVVAQLL (orange) separated by a bend illustrated by Trp326 (yellow). PDB code: 2KNU.

Structure of E1 pre-transmembrane region determined by NOE experiments (Spadaccini et al., 2010). Two alpha helices MAWDM (cyan) and AALVVAQLL (orange) separated by a bend illustrated by Trp326 (yellow). PDB code: 2KNU.