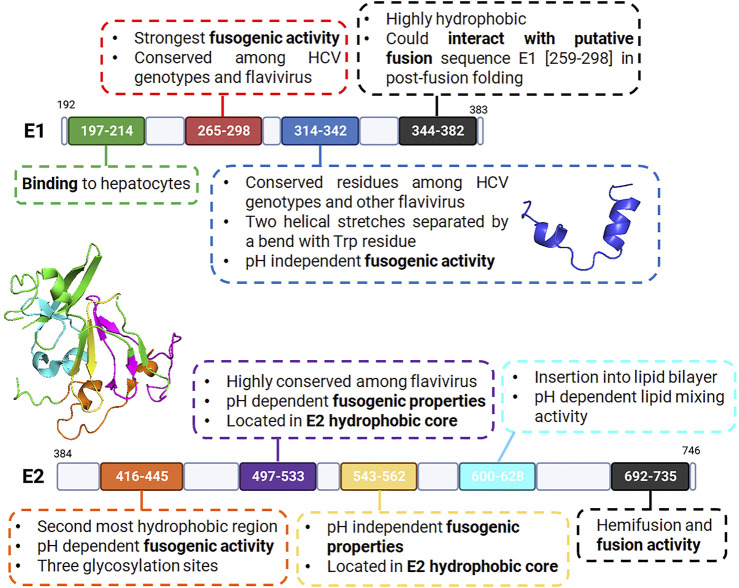
FIGURE 8.
Schematic representation of HCV E1 and E2 fusion proteins with selected membrane active sequences, and their corresponding properties according to literature. Upper panel: HCV E1 protein with N-terminal domain (green), putative fusion peptide (red), pre-transmembrane domain (blue) and its structure determined by Spadaccini et al. (PDB code 2KNU) and C-terminal region including the transmembrane domain (black). Lower panel: HCV E2 protein and its partial ectodomain structure (determined by Kong et al. (Kong et al., 2013), PDB code 4MWF) with N-terminal domain flanked by hypervariable regions (orange), hydrophobic core region (purple and gold), pre-transmembrane domain (cyan) and C-terminal region transmembrane domain (black).

