Figure 1.
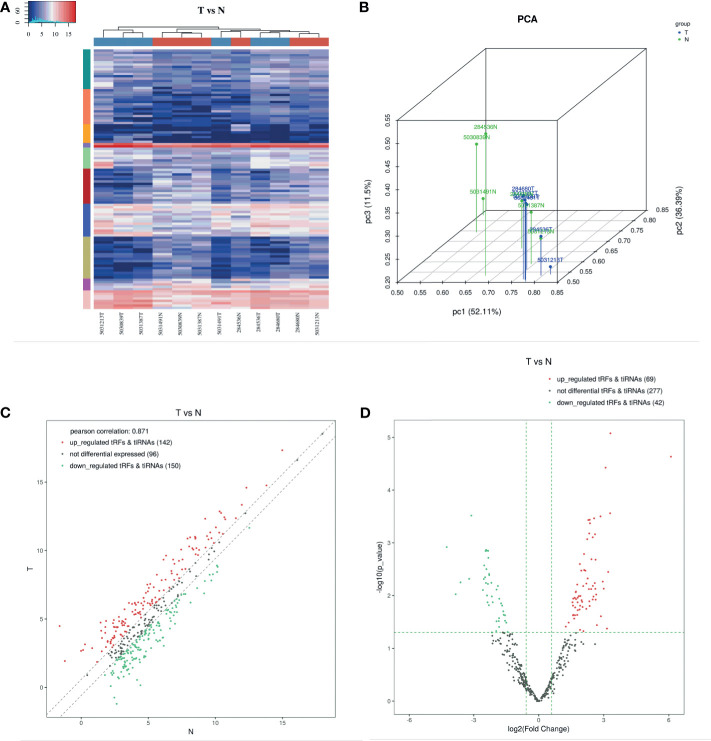
Expression Profiles of tRNA-derived Fragments. (A) The hierarchical clustering heatmap for tRF & tiRNA. In this heatmap, the upper color bar represents the group classification of gastric cancer tissues and NATs. The left color bar of the panel represents the cluster analysis of differentially expressed tsRNAs based on K-means. Generally, red indicates the high expression level, and blue indicates the low expression level. (B) Primary component analysis. The result of PCA analysis shows a distinguishable tRF & tiRNA expression profiling among the GC and NATs samples. The figure is an overview of samples correlations. (C) The scatter plot between two groups for tRF & tiRNA. 142 up-regulated tRFs & tiRNAs, 150 down-regulated tRFs & tiRNAs, and 96 not differential expressed tRFs & tiRNAs were screened out. The Pearson correlation between GC and NATs was 0.871. (D) The volcano plot of tRF & tiRNA. The volcano plot is based on CPM values of tsRNAs, and we found that 69 up-regulated tRFs & tiRNAs, 42 down-regulated tRFs & tiRNAs, and 277 not differential tRFs & tiRNAs were uncovered.

