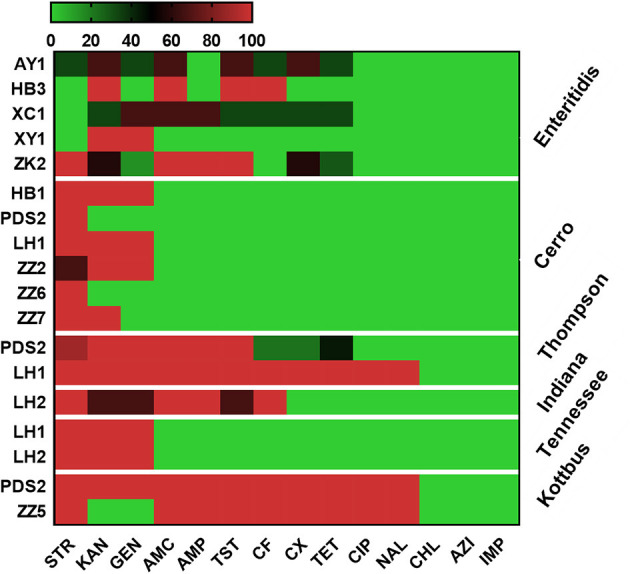
Figure 3.

Heat map showing the antimicrobial resistance profile of different serovars isolated from different hatcheries. N.B., X-axis indicates antimicrobials and Y-axis indicates Salmonella serovars and Hatcheries. The antimicrobials used in this assay were as follows: ampicillin (AMP), amoxicillin and clavulanate potassium (AMC), gentamicin (GEN), kanamycin (KAN), streptomycin (STR), tetracycline (TET), ciprofloxacin (CIP), nalidixic (NAL), chloramphenicol (CHL), ceftiofur (CF), cefoxitin (CX), trimethoprim and sulfamethoxazole (TST), azithromycin (AZI), and imipenem (IMP). The abbreviations on the left side of the Y axis refer to the hatcheries located in Henan city. AY1 in Anyang city, HB1 and HB3 in Hebi city, LH1 and LH2 in Luohe city, PDS2 in Pingdingshan city, XC1 in Xuchang city, XY1 in Xinyang city, ZK2 in Zhoukou, ZZ2, ZZ5, ZZ6, and ZZ7 in Zhengzhou city. The scale showed the percentage of resistance for the isolates (from 0 to 100%). The strength of the colors corresponds to the numerical value of the prevalence of resistant isolates. Green revealed to susceptible and red revealed to resistant isolates.
