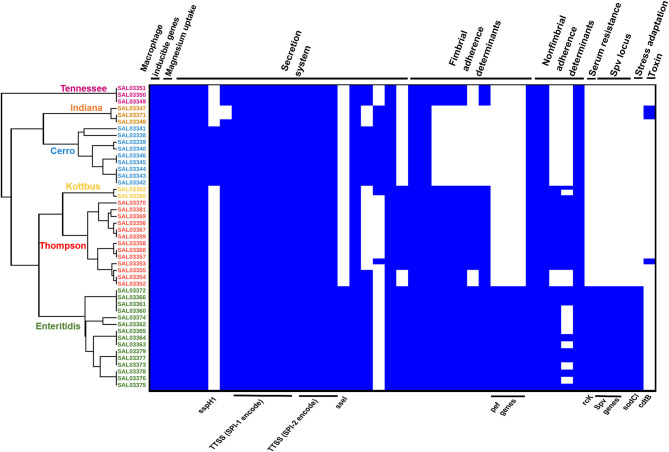
Figure 6.
The combinatorial graph of the wgMLST phylogenomic evolutionary tree and virulence genes in the S. enterica isolates. The figure showed that S. enteritidis harbored a higher number of virulence genes compared with other serovars. In the heat map of the virulence genes, blue color refers to “presence,” white color refers to “absence.” The figure showed that pef, rck, sodCl, and spv loci in addition to ssel genes were detected only in the S. enteritidis isolates. Besides, one S. thompson isolate and two S. Indiana isolates harbored the gene cdtB encoding typhoid toxins. All the isolates harbored Salmonella pathogenicity islands 1 and 2 (SPI-1 and SPI-2) virulence factors. N.B., According to the phylogenomic tree, green color refers to S. Enteritidis isolates, orange color refers to S. Cerro isolates, brown color refers to S. Kottbus isolates, gray color refers to S. Indiana isolates, and red color refers to S. Thompson isolates.

