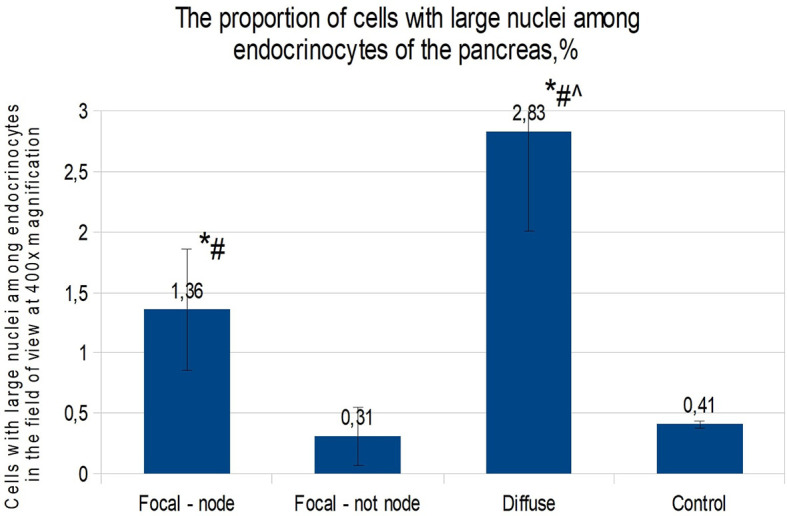
Figure 4.

The proportion of cells with enlarged nuclei among endocrinocytes in the field of view (percentage), frozen sections. Data are presented as M ± SD. (*) - the difference in comparison with the control is statistically significant at p <0.05; (#) - the difference in comparison with tissue of the pancreas outside the lesion in the focal form is statistically significant at p <0.01; (^) - the difference compared with the zone of adenomatous hyperplasia is statistically significant at p <0.01. Note: focal node - zone of adenomatous hyperplasia in focal form; focal not node - pancreatic tissue outside the zone of adenomatous hyperplasia; diffuse - diffuse form.
