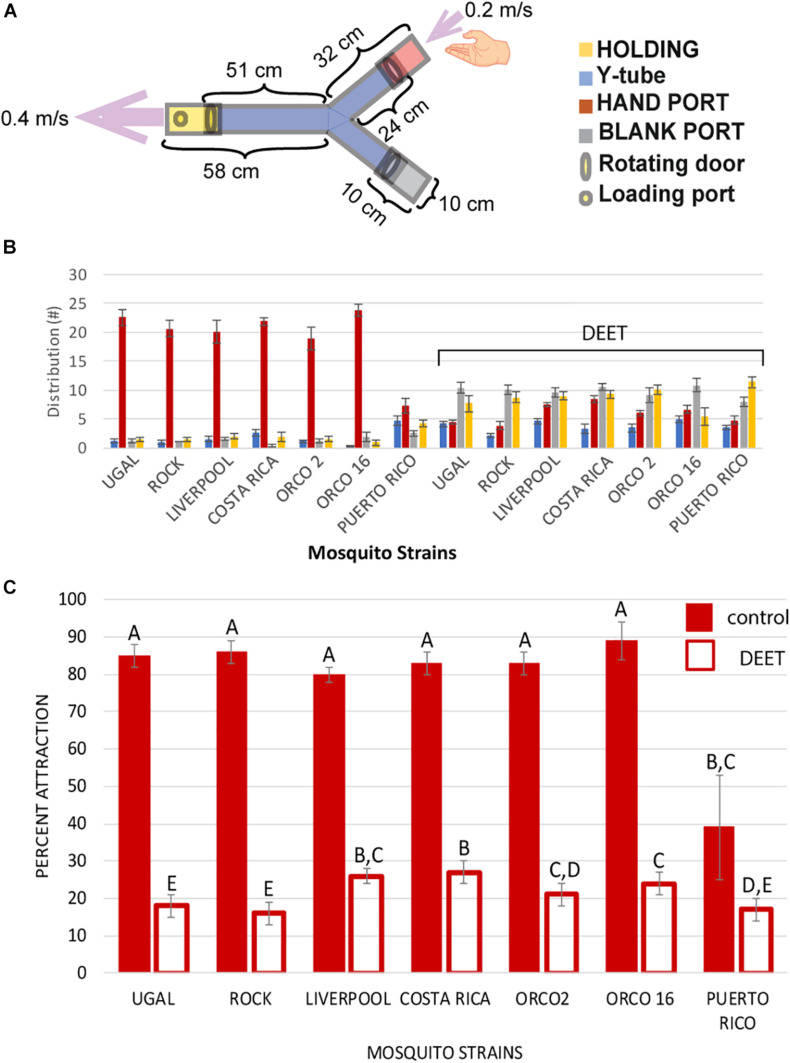
FIGURE 1.
Mosquito attraction bioassay using a Y-tube olfactometer. (A) Diagram of Y-tube olfactometer. Dimensions are given in centimeters. Arrows and values represent direction and speed of airflow. (B) Distribution of mosquitoes in each Y-tube chamber at the end of each assay. Strains were exposed to either a control hand (left set), or a DEET treated hand (right set under “DEET” bracket). Data is presented as average number of mosquitoes from four treatments in each chamber ± SEM. Column colors correspond to chamber colors in the legend of (A). (C) Percent attraction of mosquito strains to the control hand (red columns) and the DEET-treated hand (empty columns) for each mosquito strain. Data is presented as average percent attraction from four treatments ± SEM. Letters above columns represent statistical significance categories determined by Mann–Whitney U tests, with different letters representing significantly different (p < 0.05) attraction rates. See section “Materials and Methods” Y-tube olfactometer bioassay for a description of how percent attraction was determined.

