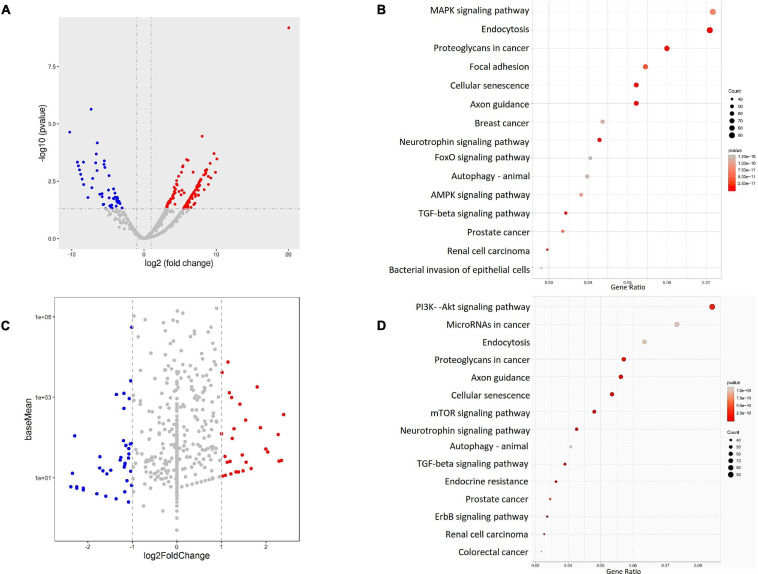
FIGURE 2.
The miRNA profiles of the PD patient (N = 22) and healthy volunteers (N = 9) plasma (A,B) and exosomes (C,D) were identified by RNA sequencing, and the results were visualized by (A,C) a volcano plot, which shows the differentially expressed miRNAs. The target genes of the identified miRNAs were analyzed by (B,D) KEGG pathway enrichment to identify the possible downstream signaling pathways.

