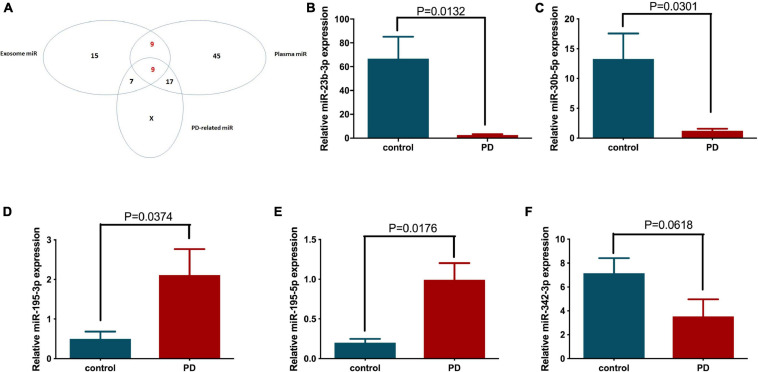
FIGURE 3.
The differentially expressed miRNAs between healthy volunteer and PD patient plasma and circulating exosomes were classified, and their expression patterns in patient plasma were further confirmed by quantitative PCR. (A) The Venn diagram shows the relationships between the differentially expressed plasma miRNAs, circulating exosomal miRNAs and the bioinformatics predicted PD-related miRNAs. The expression levels of (B) miR-23b-3p, (C) miR-30b-5p, (D) miR-342-3p, (E) miR-195-3p, and (F) miR-195-5p in the individual patient (N = 5) and healthy volunteer (N = 7) plasma were examined by quantitative PCR.

