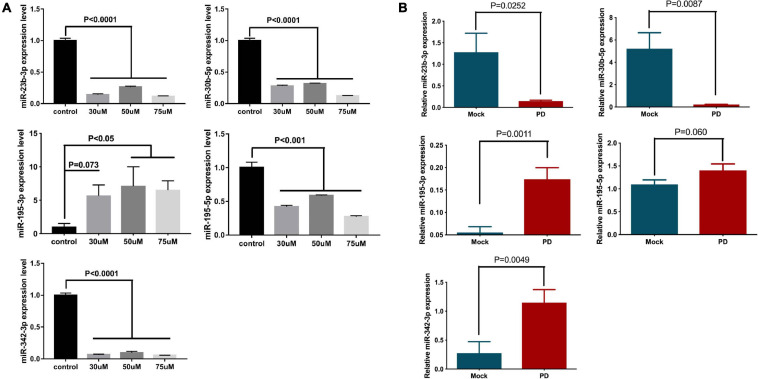
FIGURE 4.
The expression levels of miR-23b-3p, miR-30b-5p, miR-342-3p, miR-195-3p, and miR-195-5p in the in vitro and in vivo Parkinsonism models. (A) NSCs were treated with 30, 50, and 75 μM 6-OHDA for 24 h, and the expression of miR-23b-3p, miR-30b-5p, miR-342-3p, miR-195-3p, and miR-195-5p was measured. The data are collected from three independent experiments (N = 3) and expressed as mean + SEM. (B) The expression levels of miR-23b-3p, miR-30b-5p, miR-342-3p, miR-195-3p, and miR-195-5p were tested in the 6-OHDA-induced rat Parkinsonism model group (N = 8) and control mock injection group (N = 6).

