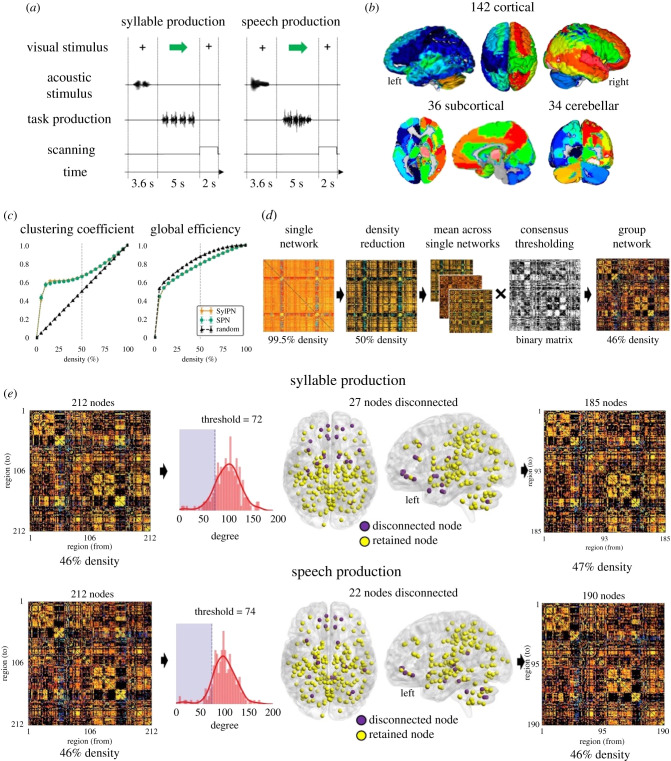
Figure 1.
Overview of the experimental design and data processing pipeline. (a) Schematic illustrations of the experimental paradigms for speech and syllable production tasks. (b) Whole-brain parcellations using the cytoarchitectonic maximum probability map and macrolabel atlases composed of 142 cortical, 36 subcortical and 34 cerebellar regions of interest (ROIs). ROIs are visualized using Mango 4.1 software. (c) Clustering coefficient and global efficiency of random and empirical networks at different levels of density. The dashed lines depict the metrics values at 50% density. (d) Schematic of the fMRI data processing pipeline. (e) Schematic of the nodal elimination strategy employed to disconnect low-degree nodes from the group network. The histogram shows the distribution of nodal degrees across the 212 ROIs. Nodes with a degree lower than one standard deviation from the average degree were disconnected (22 nodes, shaded purple area). The final group matrix included 185 nodes for syllable production and 190 nodes for speech production. Disconnected and retained nodes are shown on three-dimensional brain renderings using BrainNet Viewer software.

