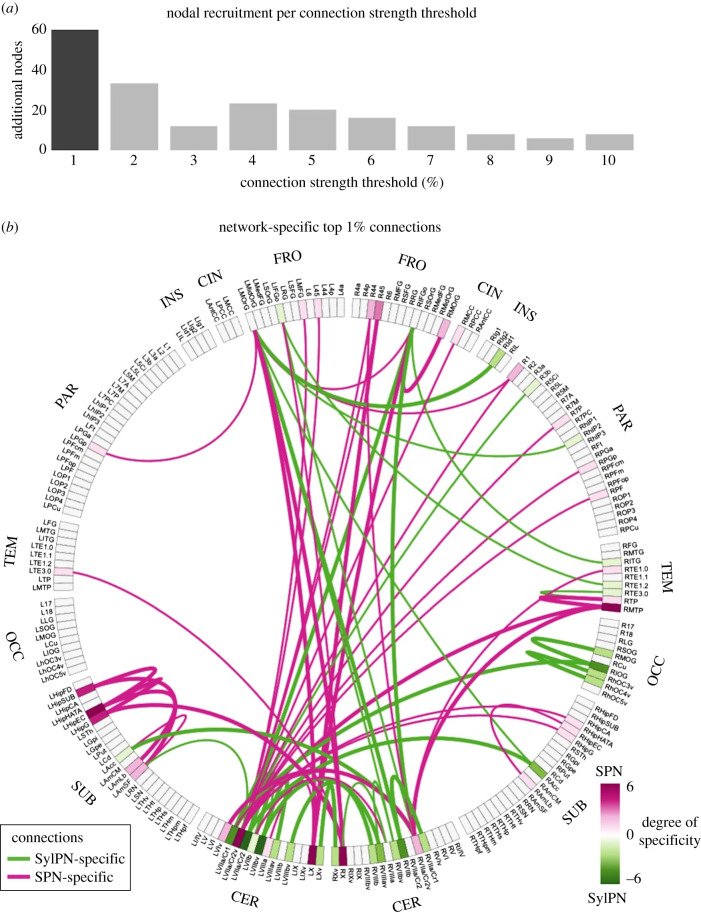
Figure 3.
Network-specific most influential connections. (a) The bar graph represents the number of brain regions expressing network-specific connections recruited when increasing the strength threshold by 1% steps. The darker bar represents the most stringent connection threshold (1%) which allows recruitment of the largest number of network-specific nodes. (b) The strongest network-specific connections at 1% threshold are represented as a connectogram. Labels on the outer circle show the anatomical lobe for each node. Each brain region is indicated by an abbreviation. Inside the circle, the strongest 1% of connections exhibiting the difference between the SPN and SylPN are displayed as edges, SPN-specific (pink) and SylPN-specific (green). The thickness of each line represents a unidirectional (thin line) or bidirectional (thick line) connection specific to that network. The colour of each brain region label shows the degree of specificity of a given region, which represents to what extent the node is involved in SPN-specific or SylPN-specific connections. Abbreviations: FRO = frontal; CIN = cingulate; INS = insula; PAR = parietal; TEM = temporal; OCC = occipital; SUB = subcortical; CER = cerebellum.

