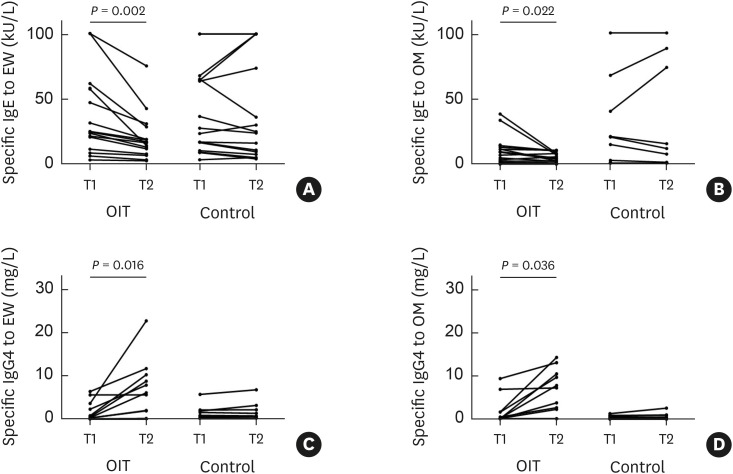
Fig. 2. Levels of EW- and OM-specific IgE (A and B) and EW- and OM-specific IgG4 (C and D) at T1 and T2 in the OIT and control groups. T1 and T2 in the OIT group are at baseline and after the build-up phase, respectively, whereas the time between T1 and T2 in the control group refers to the elapsed period from diagnosis matched with the OIT group. Serum specific IgG4 levels were measured in 10 and 9 patients in the OIT and control groups, respectively.
EW, egg white; OM, ovomucoid; Ig, immunoglobulin; OIT, oral immunotherapy.

