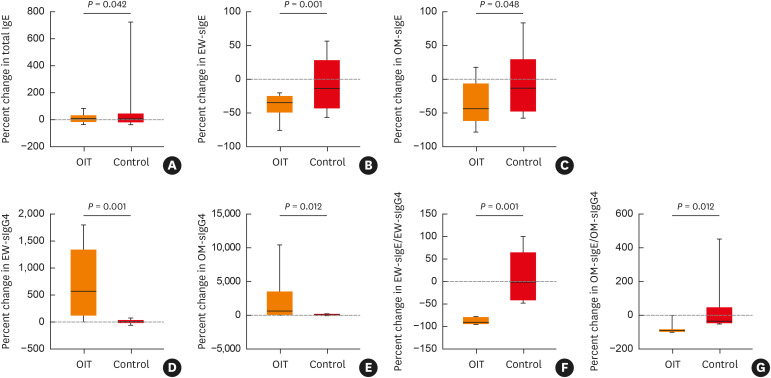
Fig. 3. Percent changes at the end of the build-up phase/follow-up from baseline in total IgE (A), EW-sIgE (B), OM-sIgE (C), EW-sIgG4 (D), OM-sIgG4 (E), the ratio of EW-sIgE to EW-sIgG4 (F) and the ratio of EW-sIgE to EW-sIgG4 (G) in the OIT and control groups. Serum sIgG4 levels were measured in 10 and 9 patients in the OIT and control groups, respectively.
Ig, immunoglobulin; sIg, specific immunoglobulin; OIT, oral immunotherapy group; Control, control group; EW, egg white; OM, ovomucoid.

