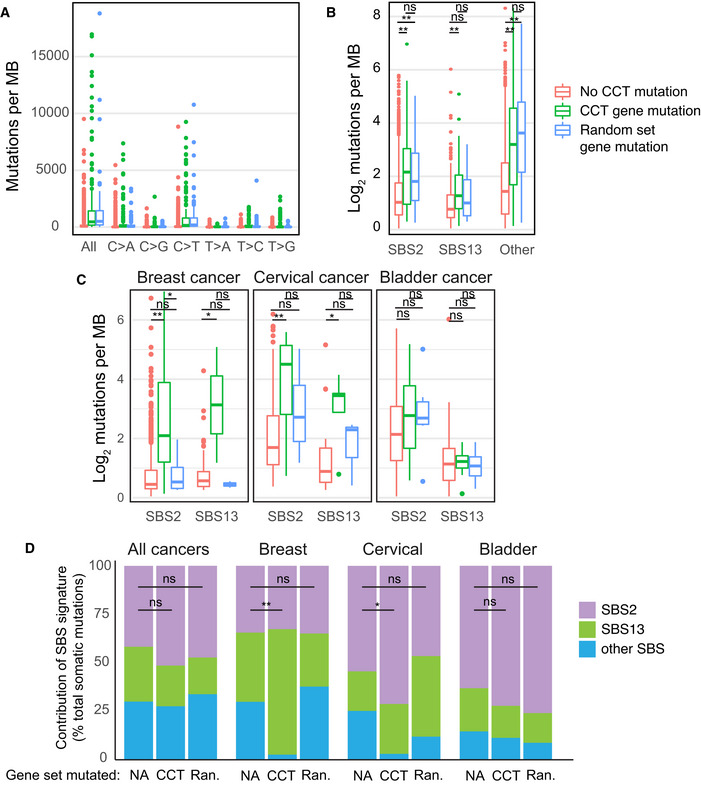
All cancer genome sequences in TCGA were evaluated for mutation burden and specific base substitutions. Cancers with deleterious mutations in one or more CCT complex genes were compared to a control group of primary cancers that harbor deleterious mutations in a random gene set. The random gene set was constructed from 9 genes of similar size to those that comprise CCT members, and with similarly frequent mutational rate among the 9 genes relative to mutation rate among CCT complex genes. Wilcoxon rank sum test was used for statistical comparison. For each column on the x‐axis, a comparison between tumors without CCT mutations and those with CCT mutations is significant (P < 0.01). Similarly, for each x‐axis column a comparison between tumors without CCT mutations and those with random gene mutations is significant (P < 0.01). For each x‐axis column, a comparison between tumors with CCT gene mutations and tumors with random gene mutations is not statistically significant.
The burden of mutations attributed to APOBEC3 activity (SBS2 and SBS13) was evaluated in CCT‐mutated, random gene set‐mutated, and all other cancer genome sequences. Depicted is the quantity of mutations within mutational signatures attributable to APOBEC3 activity (SBS2 and SBS13) in comparison with all other SBS mutational patterns (other). Wilcoxon rank sum test was used for statistical comparison. **P < 0.01 and ns non‐significant.
Quantification of APOBEC3 mutational signatures among breast, bladder, and cervical cancer samples from the TCGA database was divided into CCT‐mutated, random gene set‐mutated, and non‐mutated genomes, as above. The number of mutations contributing to SBS2 and SBS13 in each tumor type is quantified and displayed as an average. Wilcoxon rank sum test was used for statistical comparison. **P < 0.01, *P < 0.05, and ns non‐significant.
The contribution of SBS2, SBS13, and all other SBS signatures was evaluated in all tumors and independently in breast, bladder, and cervical cancer genomes within the TCGA database. A comparison of mutational signature contributions between CCT‐mutated, random gene set‐mutated (Ran.), and non‐mutated tumors is shown. A z‐test of proportions was used to compare whether the percentage of “other” signatures is significantly different between CCT‐mutated and non‐mutated tumors. **P < 0.01, *P < 0.05, and ns non‐significant.

