
Figure 4. CCT complex depletion leads to decreased cell viability when A3A is expressed.
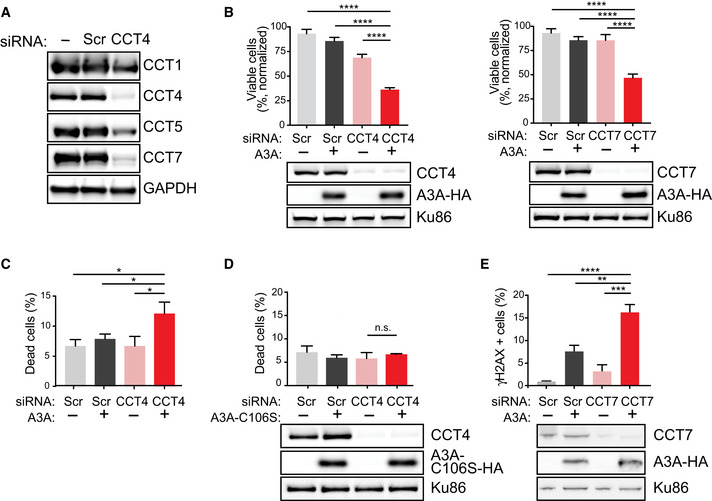
- Knockdown of one CCT complex member results in depletion of other CCT subunits. Following siCCT4 or siCCT7 transfection, cell lysates were evaluated by immunoblot for expression of additional CCT subunits by endogenous antibodies for CCT1, CCT4, CCT5, and CCT7. GAPDH was used as a loading control.
- Decreased cell viability upon CCT depletion and A3A expression. CCT4 (left) and CCT7 (right) subunits were depleted by siRNA transfection in U2OS cells with dox‐inducible A3A transgenes. Immunoblot analysis of cell lysates showed decreased expression of targeted CCT subunit, but no alteration in A3A expression. Scr indicates non‐targeted siRNA, used as control. Ku86 is a loading control. Following siRNA transfection to deplete CCT subunits, U2OS‐A3A cells were treated with dox. Viability was determined by colorimetric change after addition of a water‐soluble tetrazolium salt. Percent viability was normalized to untreated controls. Statistical analysis was performed using a paired two‐tailed t‐test, n = 3 biological replicates; error bars, SEM.
- Increased cell death resulting from A3A expression along with depletion of CCT. U2OS‐A3A cells were depleted of CCT4 by siRNA, treated with dox, or combination. Cell death was measured by staining cells with fluorescent‐labeled calcein AM (live) and DNA (dead) stains. Bar chart shows quantitation of FACS results averaged over three biological replicates. Statistical analysis was performed using a paired two‐tailed t‐test, n = 3; error bars, SEM.
- Viability of cells with catalytically inactive A3A. U2OS‐A3A‐C106S cells were induced with dox to express the catalytically inactive A3A mutant (C106S), depleted of CCT4 by siRNA, or combination. Cells were subsequently evaluated by live‐dead staining assessed by FACS. Bar chart shows quantitation of FACS results averaged over three biological replicates. Statistical analysis was performed using a paired two‐tailed t‐test, n = 3; error bars, SEM. Immunoblot analysis of cell lysates showed decreased expression of CCT4 after siRNA targeting. Ku86 is a loading control.
- Increased DNA damage signaling upon CCT depletion and A3A expression. Depletion of CCT7 in K562‐A3A cells was achieved by siRNA targeting. Expression of A3A was induced by dox treatment. Intracellular staining with anti‐γH2AX antibody was analyzed by flow cytometry. Bar chart shows quantification of FACS results obtained over three biological replicates. Statistical analysis was performed using a two‐tailed t‐test, n = 3; error bars, SEM. Immunoblot analysis of cell lysates showed decreased expression of CCT7 after siRNA targeting and A3A expression upon dox treatment. Ku86 is a loading control. **P‐value < 0.01, ***P‐value < 0.01, ****P‐value < 0.0001, and n.s. non‐significant.
Source data are available online for this figure.