
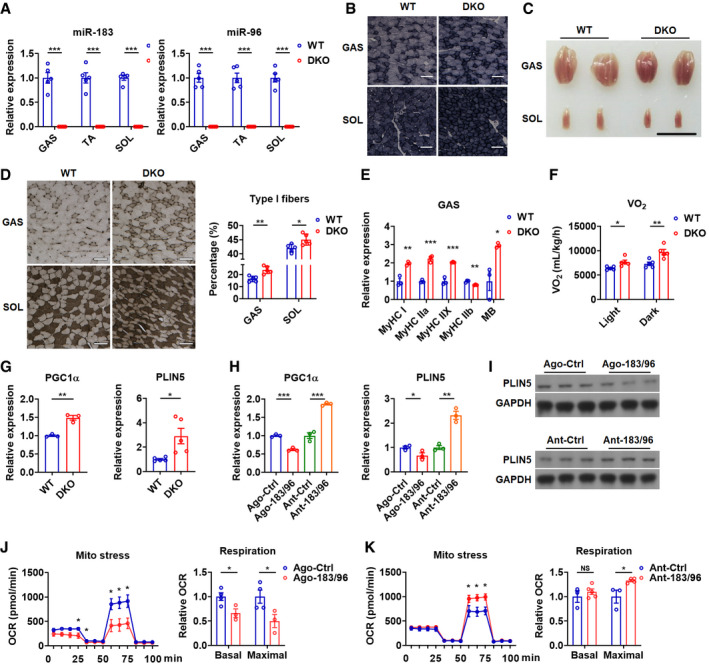
Figure 1. Loss of miR‐183 and miR‐96 enhances muscle oxidative phenotype.
-
ARelative expression of miR‐183 and miR‐96 in GAS, TA and SOL muscles of WT and DKO mice (n = 5).
-
BSDH staining of GAS and SOL muscles in WT and DKO mice (n = 5). Scale bars: 100 μm.
-
CRepresentative photographs of GAS and SOL muscles dissected from WT and DKO mice (n = 5). Scale bar: 1 cm.
-
DATPase staining of GAS and SOL muscles of WT and DKO mice (left). Corresponding percentage of type I fibers were determined (right) (n = 5). Scale bars: 100 μm.
-
ERelative mRNA expression of MHC isoforms in GAS muscles of WT and DKO mice (n = 3).
-
FOxygen consumption rate of WT and DKO mice in light and dark phases (n = 5).
-
GRelative mRNA expression of PGC1α and PLIN5 in GAS muscles of WT and DKO mice (n = 3 for PGC1α analysis; n = 5 for PLIN5 analysis).
-
HRelative mRNA expression of PGC1α and PLIN5 in C2C12 cells transfected with miR‐183 and miR‐96 agomirs (Ago‐183/96) or antagomirs (Ant‐183/96) (n = 3).
-
IWestern blot analysis of PLIN5 in C2C12 cells transfected with Ago‐183/96 or Ant‐183/96.
-
J, KMitochondrial respiration profile of C2C12 cells transfected with Ago‐183/96 (J) or Ant‐183/96 (K). Cellular oxygen consumption rate (OCR) was measured in real time, and corresponding basal and maximal respiration were analyzed by overall OCR (n = 3 or 4 per group).
Data information: Means ± SEM are shown for all panels except for left panels in panel J and K, in which means ± SD are shown. *P < 0.05 versus control; **P < 0.01 versus control; ***P < 0.001 versus control (Student’s t‐test). All experiments were performed at least three times, and representative data are shown.
Source data are available online for this figure.