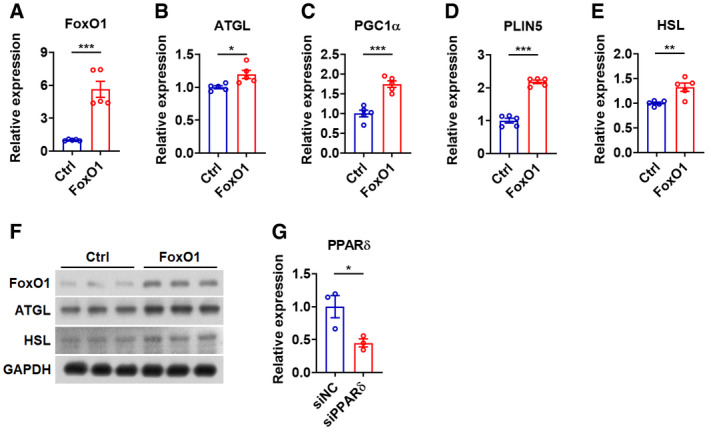
Figure EV4. miR‐183 and miR‐96 modulate fat usage via FoxO1 and ATGL in muscle cells, related to Fig 4 .

-
A–ERelative mRNA expression of FoxO1 (A), ATGL (B), PGC1α (C), PLIN5 (D), and HSL (E) in C2C12 cells transfected with FoxO1 (n = 5).
-
FWestern blot analysis of FoxO1, ATGL, and HSL in C2C12 cells transfected with FoxO1.
-
GRelative mRNA expression of PPARδ in C2C12 cells transfected with siPPARδ (n = 3). siNC: negative control oligos for siRNA.
Data information: Means ± SEM are shown for all panels. *P < 0.05 versus control; **P < 0.01 versus control; ***P < 0.001 versus control (Student’s t‐test). All experiments were performed at least three times, and representative data are shown.Source data are available online for this figure.
