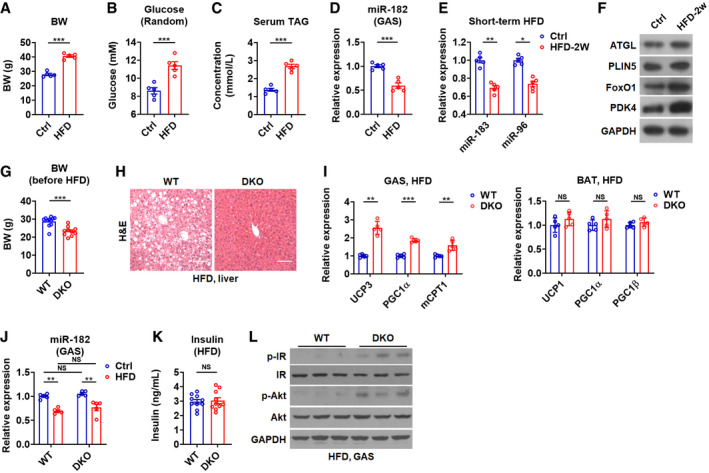
Figure EV5. miR‐183 and miR‐96 levels in skeletal muscles alter upon HFD feeding and loss of miR‐183 and miR‐96 protects mice from diet‐induced obesity and glucose intolerance, related to Figs 5 and 6 .

- Body weight of C57BL/6 mice after a HFD feeding for 2 months (n = 5).
- Random glucose levels of C57BL/6 mice after a HFD feeding for 2 months (n = 5).
- Serum TAG levels of C57BL/6 mice after a HFD feeding for 2 months (n = 5).
- Relative mRNA expression of miR‐182 in GAS muscles of C57BL/6 mice after HFD feeding (n = 5).
- Relative mRNA expression of miR‐183 and miR‐96 in the GAS muscles of mice after 2 weeks of HFD feeding (n = 5).
- Western blot analysis of ATGL, PLIN5, FoxO1, and PDK4 in the GAS muscles of mice after 2 weeks of HFD feeding.
- Body weight of C57BL/6 mice before a HFD feeding (n = 10–11).
- H&E staining of the liver of WT and DKO mice after a HFD feeding Scale bar: 100 μm.
- Relative mRNA expression of UCP3, PGC1α, and mCPT1 in GAS muscles of WT and DKO mice after a HFD feeding (n = 5) (left). Relative mRNA expression of UCP1, PGC1α, and PGC1β in the BAT of WT and DKO mice after a HFD feeding (n = 5) (right).
- Relative mRNA expression of miR‐182 in GAS muscles of WT and DKO mice after a HFD feeding (n = 5).
- Serum insulin levels in WT and DKO mice after a HFD feeding (n = 10) were determined.
- Western blot analysis of p‐IR, IR, p‐Akt, and Akt in GAS muscles of WT and DKO mice after a HFD feeding.
Data information: Means ± SEM are shown for all panels. *P < 0.05; **P < 0.01; ***P < 0.001; NS, not significant (Student’s t‐test). All experiments were performed at least three times, and representative data are shown.Source data are available online for this figure.
