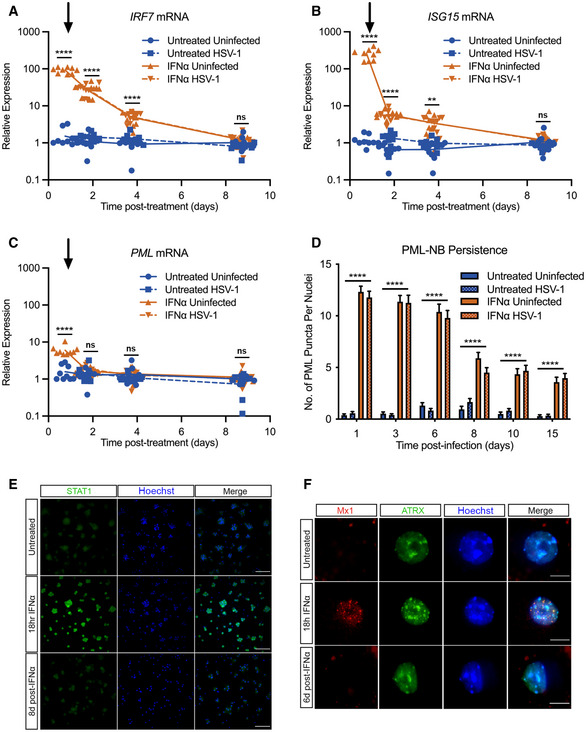
Figure 3. Type I IFN‐induced PML‐NBs persist in primary sympathetic neurons despite resolution of IFN signaling.

-
A–CKinetics of ISG15, IRF7, and PML mRNA expression at 0.75, 1.75, 3.75, and 8.75 days post‐ΙFNα (600 IU/ml) treatment. Arrow indicates the time of HSV‐1 infection at 18 h post‐interferon treatment. n = 9 biological replicates.
-
DQuantification of PML puncta at 1, 3, 6, 8, 10 and 15 days post‐infection with HSV‐1 in untreated and IFNα (600 IU/ml)‐treated SCG neurons. n ≥ 60 cells from 3 biological replicates.
-
ERepresentative images of P6 SCG neurons treated with IFNα (600 IU/ml) and stained for STAT1 at 18 h and 8 days post‐treatment. Scale bar, 100 μm.
-
FRepresentative images of P6 SCG neurons treated with IFNα (600 IU/ml) and stained for Mx1 at 18 h and 6 days post‐treatment. Scale bar, 20 μm.
Data information: Data represent the mean ± SEM. Statistical comparisons were made using one‐way ANOVA with Tukey’s multiple comparison (A–C) or mixed‐effects analysis with Tukey’s multiple comparison (D). (ns not significant, **P < 0.01, ****P < 0.0001).
Source data are available online for this figure.
