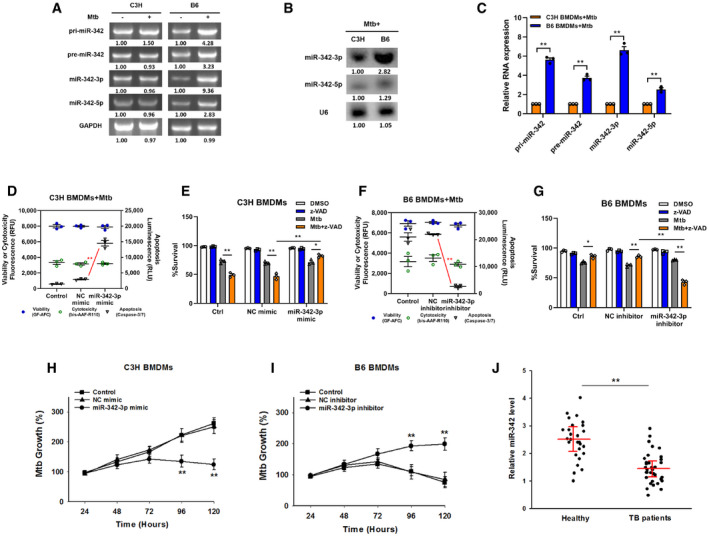
Figure 1. MiR‐342‐3p associates with TB susceptibility.

-
AExpression changes of pri‐, pre‐, and mature miR‐342 transcripts were analyzed by semiquantitative PCR in C3H or B6 BMDMs after Mtb infection. Representative blots from n = 3 biological replicates are shown.
-
B, CThe relative expressions of miR‐342‐3p and miR‐342‐5p were analyzed by northern blotting (B, representative blots from n = 3 biological replicates are shown) or quantitative real‐time PCR (C, data are shown as the mean ± SEM of n = 3 biological replicates) in Mtb‐stimulated C3H and B6 BMDMs.
-
D–GCell death mechanisms of C3H BMDMs transfected with miR‐342‐3p mimic (D), or B6 BMDMs transfected with miR‐342‐3p inhibitor (F), followed by Mtb infection for 36 h. Cell viabilities of C3H BMDMs transfected with miR‐342‐3p mimic (E), or B6 BMDMs transfected with miR‐342‐3p inhibitor (G), followed by stimulation with Mtb or z‐VAD (20 μM) for 24 h. Data are shown as the mean ± SEM of n = 3 biological replicates.
-
H, IMtb growth rates of C3H BMDMs transfected with miR‐342‐3p mimic (H), or B6 BMDMs transfected with miR‐342‐3p inhibitor (I) after Mtb infection. Data are shown as the mean ± SEM of n = 3 biological replicates.
-
JExpression levels of miR‐342‐3p in PBMCs from healthy controls (n = 27) or TB patients (n = 34) were detected by qRT–PCR. Data are shown as the medians ± interquartile ranges.
Data information: ANOVA followed by Bonferroni post hoc test (C‐I) and Mann–Whitney U test (J) were used for data analysis. *P < 0.05, **P < 0.01. Abbreviation: NC, negative control.
Source data are available online for this figure.
