
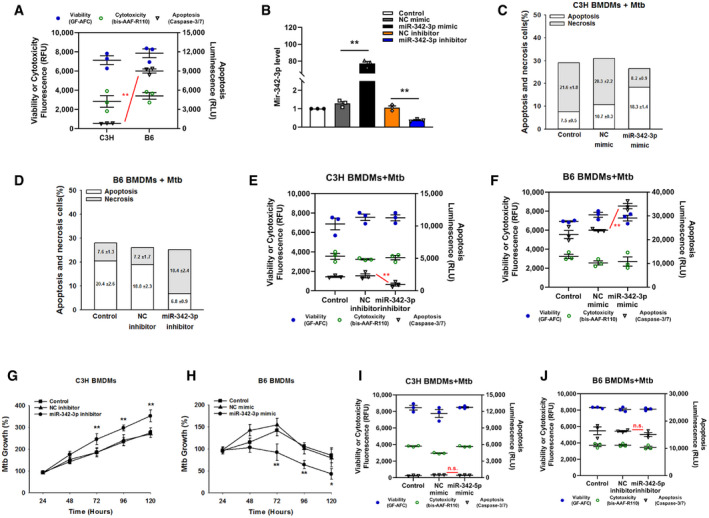
Figure EV1. MiR‐342‐3p is associated with TB susceptibility.
-
ACell death mechanisms of C3H and B6 BMDMs after stimulation with Mtb for 36 h. Data are shown as the mean ± SEM of n = 3 biological replicates.
-
BRelative miRNA expression was detected by qRT–PCR using miR‐342‐3p specific primer. Data are shown as the mean ± SEM of n = 3 biological replicates.
-
C, DCell death mechanisms of C3H BMDMs transfected with miR‐342‐3p mimic (C), or B6 BMDMs transfected with miR‐342‐3p inhibitor (D), followed by Mtb infection for 36 h. Representative data (from n = 3 biological replicates) are shown as the mean ± SEM of technical replicates.
-
E, FCell death mechanisms of C3H BMDMs transfected with miR‐342‐3p inhibitor (E), or B6 BMDMs transfected with miR‐342‐3p mimic (F), followed by Mtb infection for 36 h. Data are shown as the mean ± SEM of n = 3 biological replicates.
-
G, HMtb growth rates of C3H BMDMs transfected with miR‐342‐3p inhibitor (G), or B6 BMDMs transfected with miR‐342‐3p mimic (H) after Mtb infection. Data are shown as the mean ± SEM of n = 3 biological replicates.
-
I, JCell death mechanisms of C3H BMDMs transfected with miR‐342‐5p mimic (I), or B6 BMDMs transfected with miR‐342‐5p inhibitor (J), followed by Mtb infection for 36 h. Data are shown as the mean ± SEM of n = 3 biological replicates.
Data information: ANOVA followed by Bonferroni post hoc test was used for data analysis (A, B, E‐J). *P < 0.05, **P < 0.01. Abbreviation: n.s., not significant. NC, negative control.
Source data are available online for this figure.