
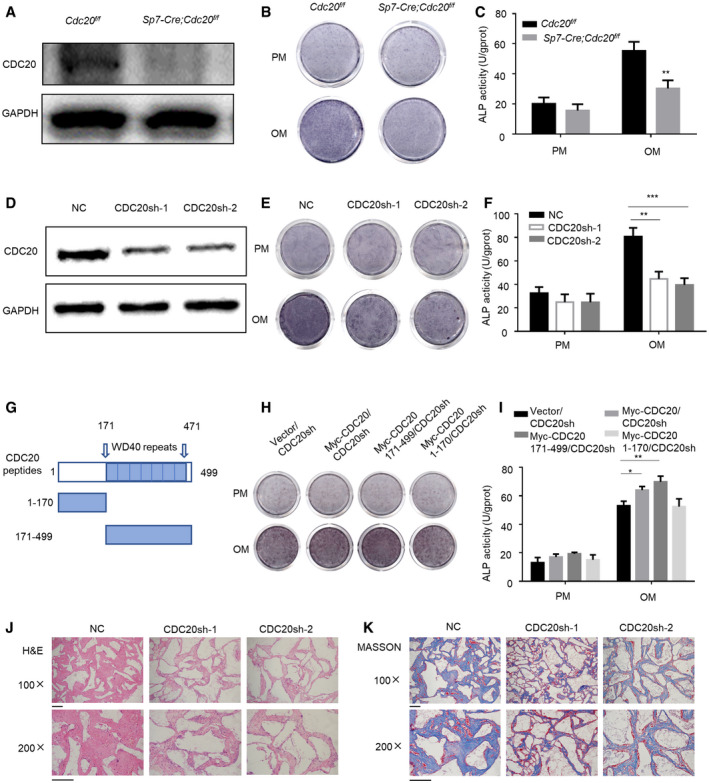
Figure 2. CDC20 modulates osteogenic differentiation of BMSCs.
-
AWestern blot analyses of the knockout efficiency of Cdc20 in Cdc20f / f and Sp7‐Cre;Cdc20f / f BMSCs.
-
B, CThe ALP staining (B) and ALP quantification (C) of Cdc20f / f and Sp7‐Cre;Cdc20f / f BMSCs after 7 days osteogenic differentiation (n = 6).
-
DThe efficiency of CDC20 knockdown determined by Western blot in hBMSCs.
-
E, FThe ALP staining (E) and ALP quantification (F) of NC and CDC20sh hBMSCs after 7 days osteogenic differentiation (n = 5).
-
GSchematic representation of the CDC20 truncated mutant fragments. The boundaries of its WD40 domain (amino acids 171–471) were shown.
-
H, IThe ALP staining (H) and ALP quantification (I) of Vector and truncated fragments overexpression of CDC20 in CDC20sh hBMSCs after 7 days osteogenic differentiation (n = 5).
-
J, KThe H&E staining (J) and Masson’s trichrome (K) of the histological sections from implanted NC and CDC20sh hBMSCs scaffold hybrids. Scale bar, 100 μm.
Data information: Data are displayed as mean ± SD and show one representative of n ≥ 3 independent experiments with three biological replicates. Statistical significance was calculated by one‐way ANOVA followed by a Tukey’s post hoc test and defined as *P < 0.05; **P < 0.01; ***P < 0.001.